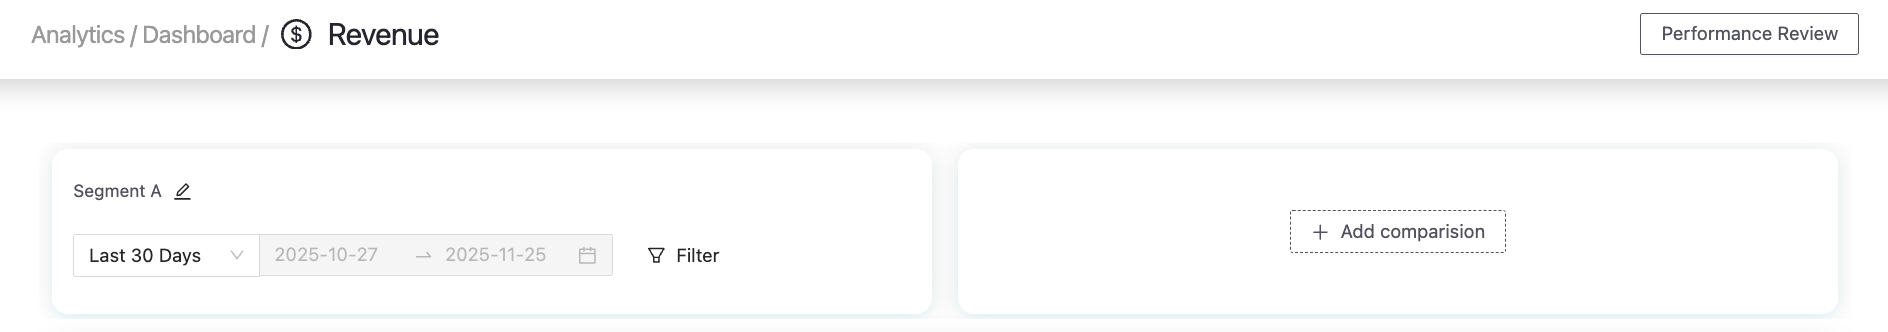
The Revenue Report in Pathmonk shows you how your website is performing in terms of conversions and revenue. It helps you understand not just the number of conversions, but also how Pathmonk influenced those results and what kind of return you’re getting from your marketing efforts.
To access the report, click on your Analytics top tab, then open Analytics Dashboard, and select Revenue.
What you can see in this report
When you open the Revenue Report, you’ll see a simple funnel with three key metrics:
Total visitors – the number of users who visited your website during the selected period.
Conversions – how many users completed your primary conversion goal (for example, a demo booking, sign-up, or purchase).
Conversion rate – the percentage of visitors who converted.
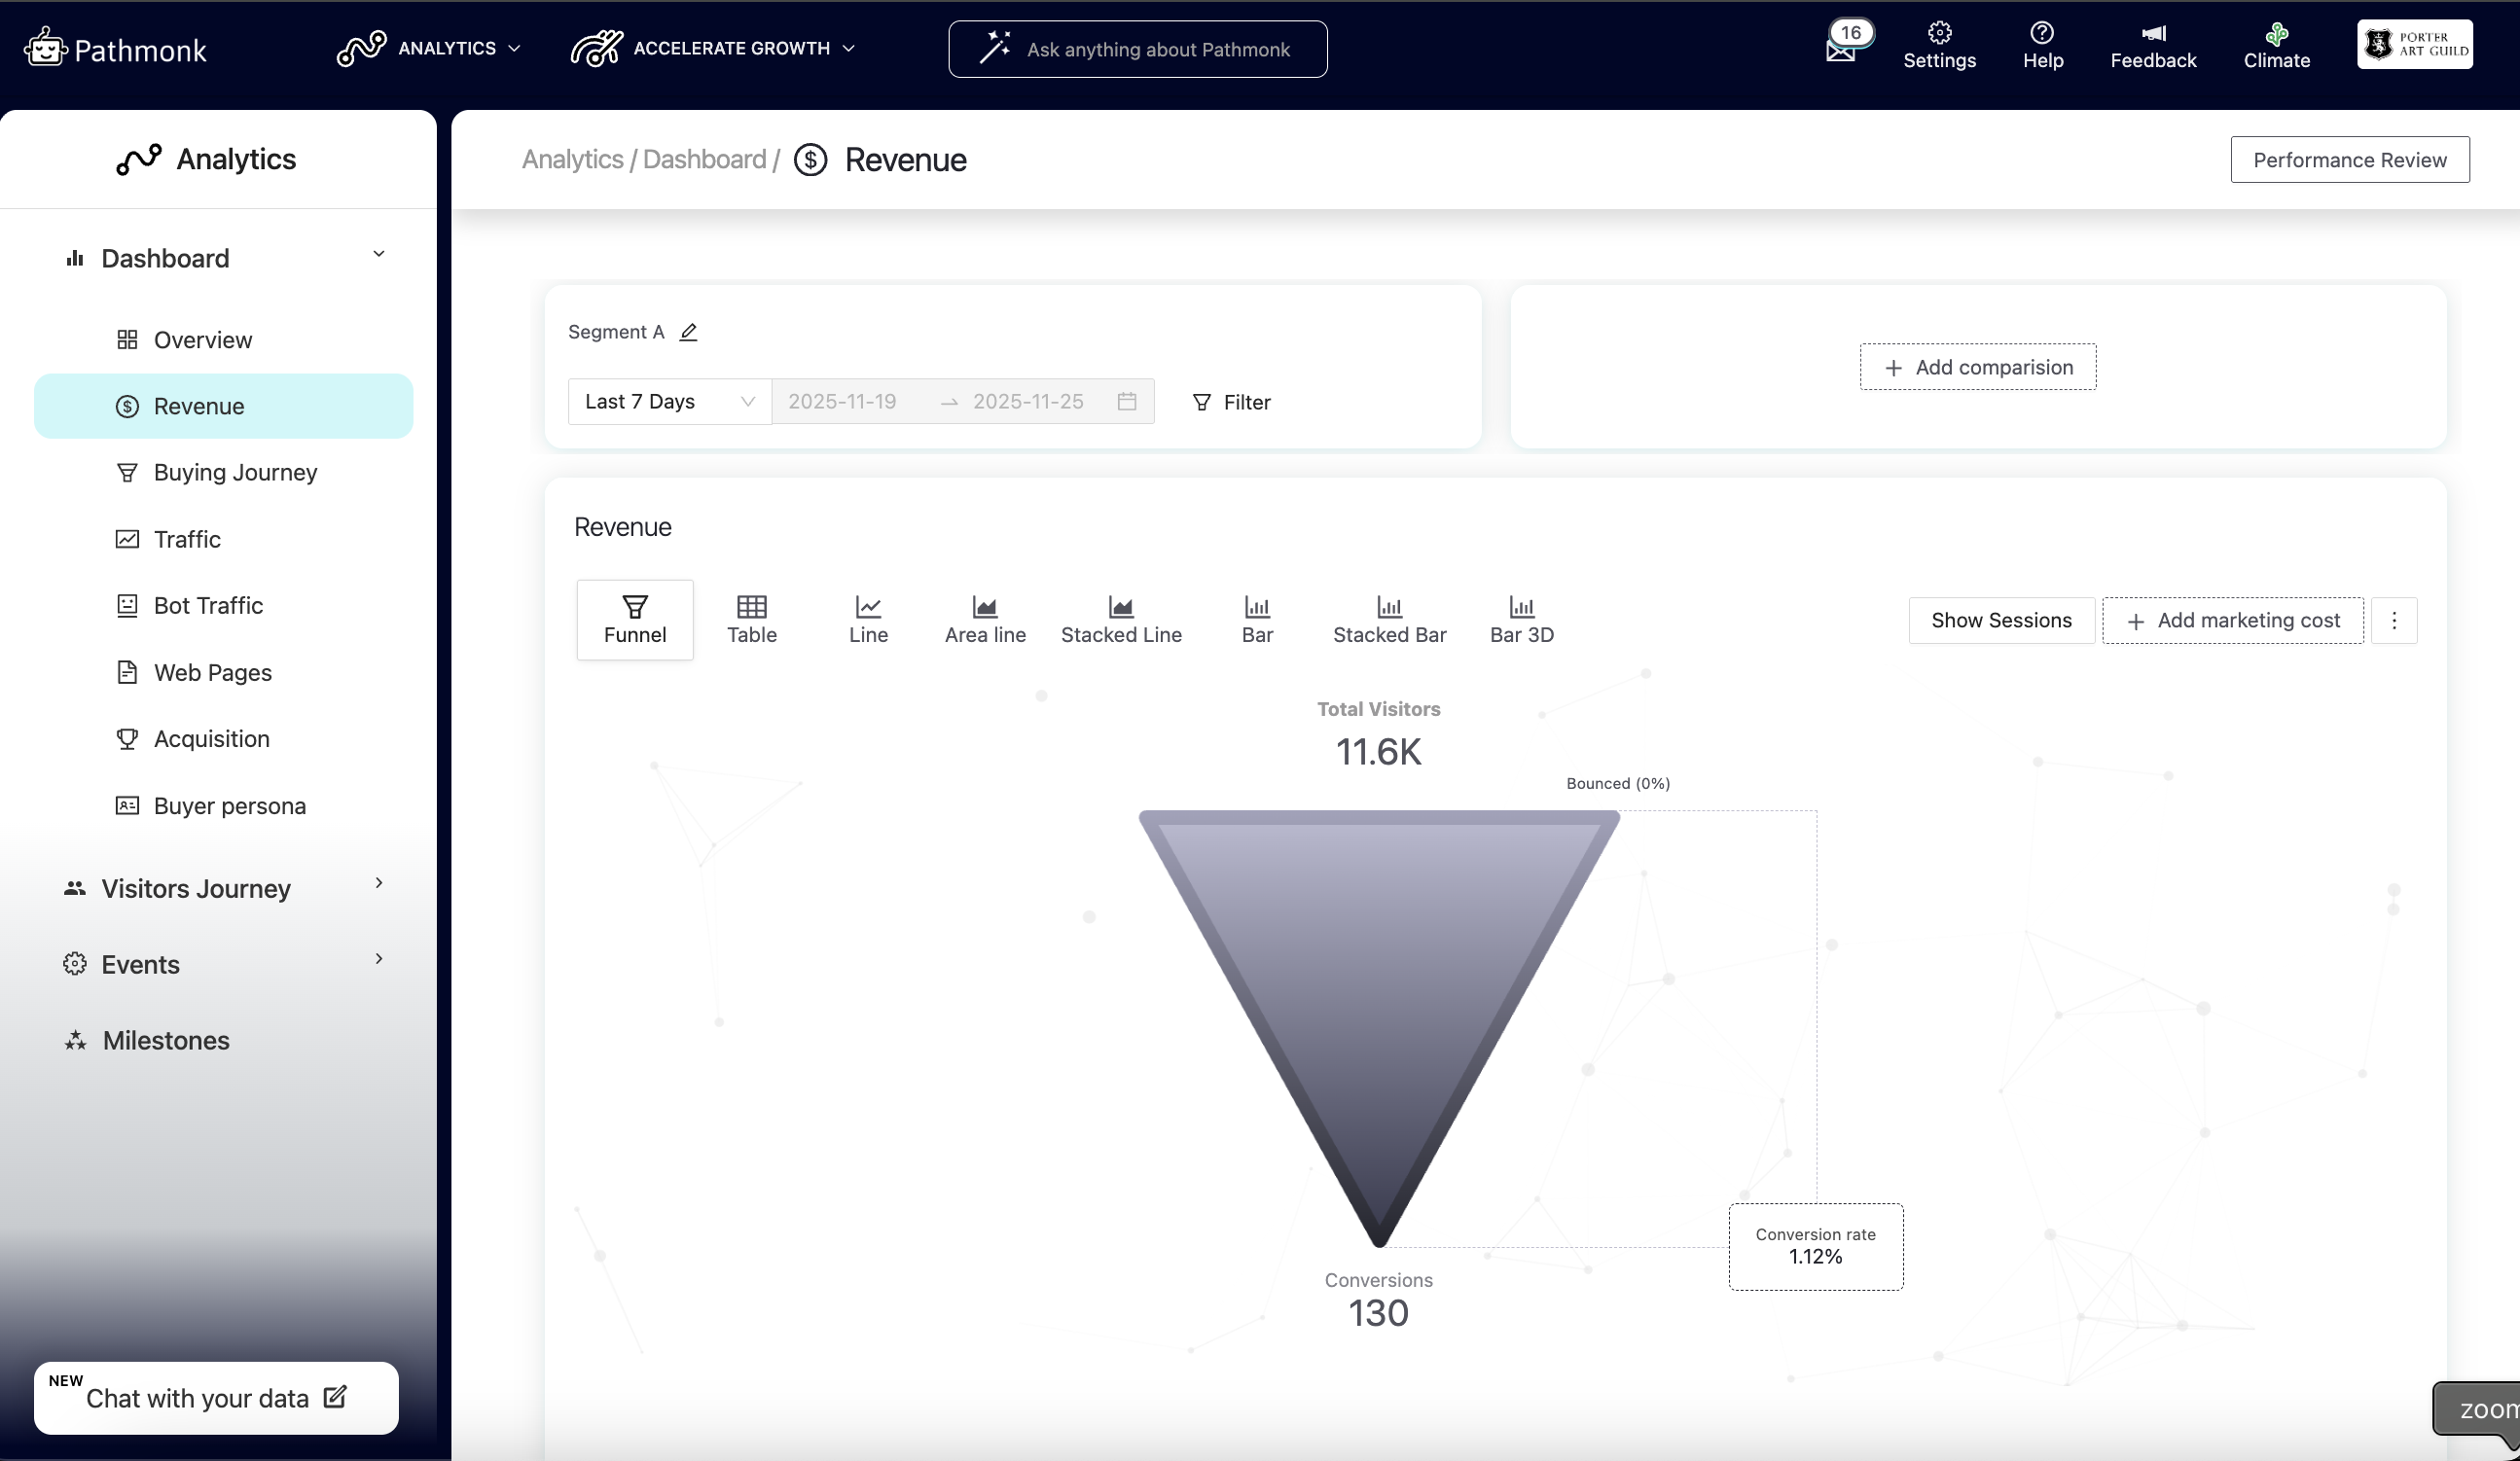
This funnel helps you understand at a glance how efficiently your website is turning traffic into conversions. You can also switch the visualization using the tabs above the funnel.
Adjusting the date range
You can select the period you want to analyze by using the date filter above the funnel.
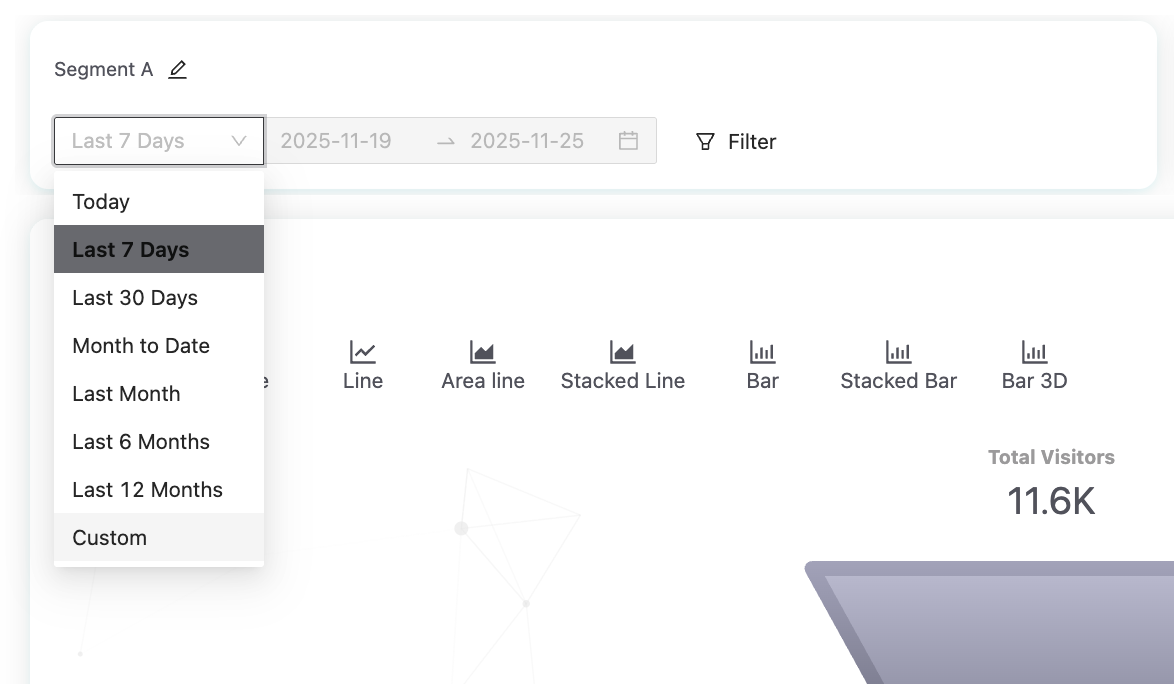
This flexibility allows you to track short-term campaign performance or analyze long-term conversion trends.
Applying advanced filters
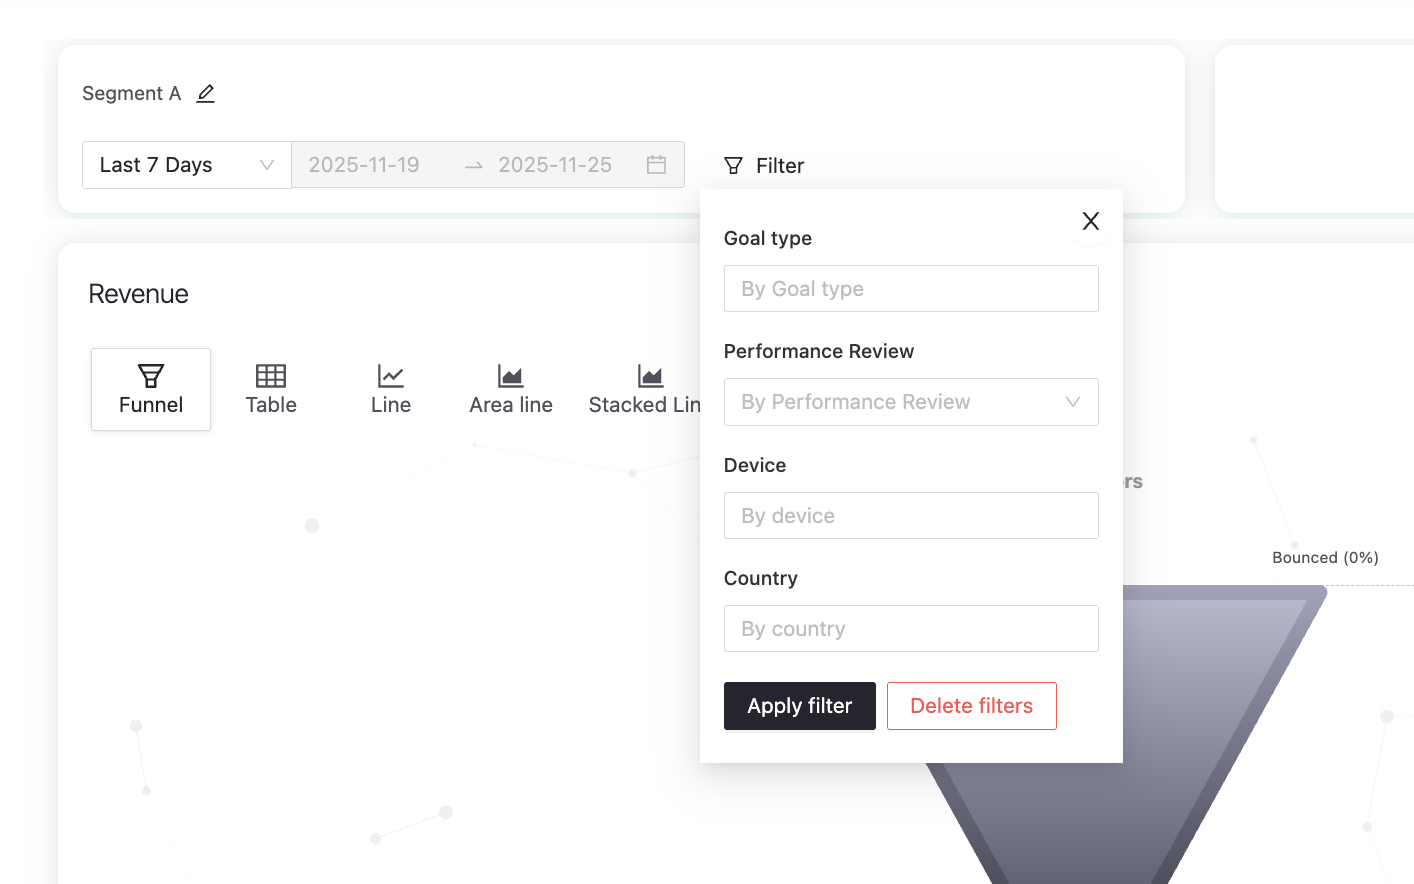
You can refine the data in the Revenue Report using the Filters. You can filter the report by goal type, performance review, device, and country, making it easier to compare how different segments behave or to validate specific hypotheses about your visitors.
Once you select your filters, click Apply filter to update the report.
Comparing two segments
The Revenue report also lets you compare two different segments side by side: Segment A and Segment B. You can use this to compare:
Two different time periods (for example, last month vs. previous month).
Two goal types
Two different devices
Two different countries
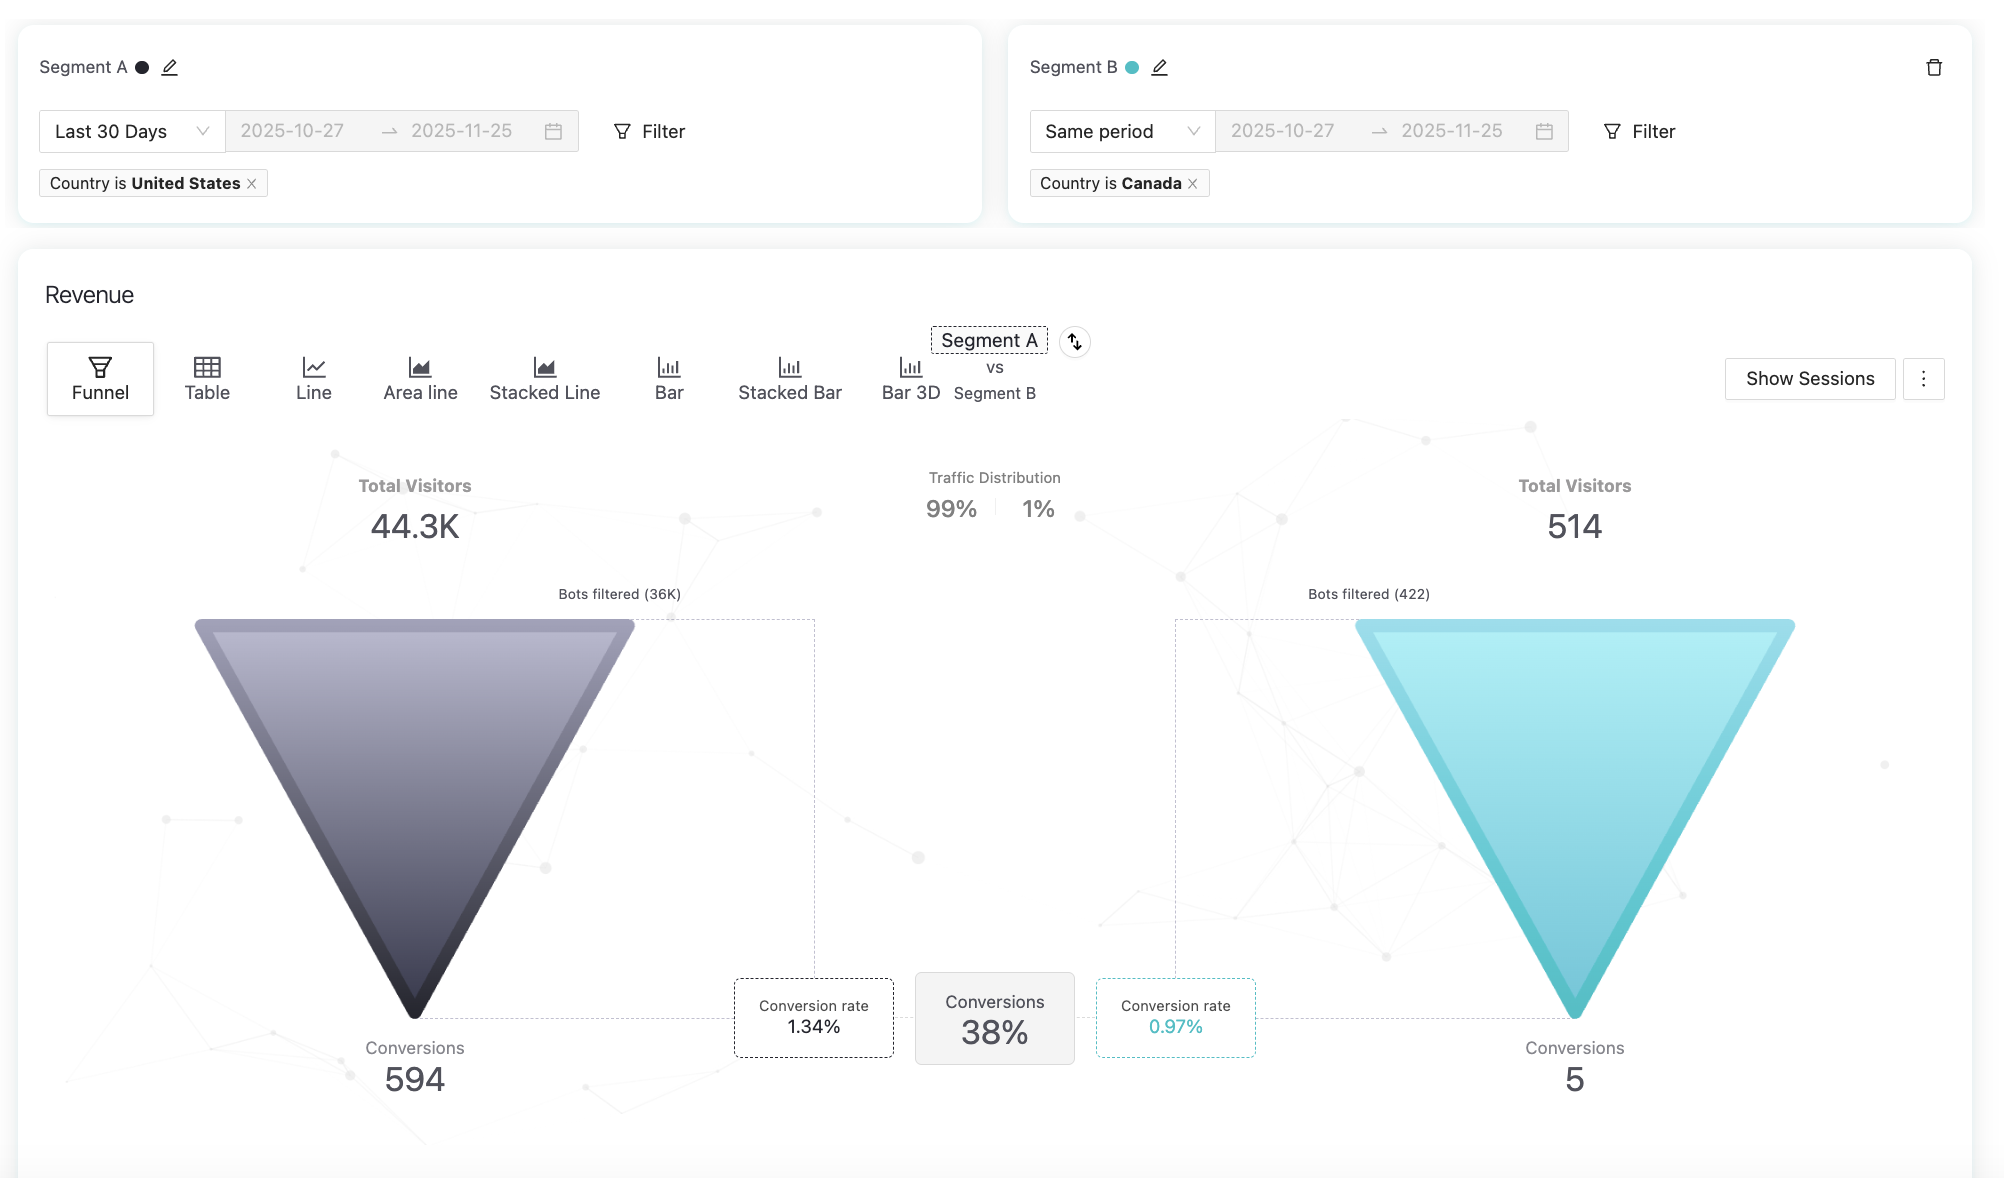
In the example above, we’re comparing the past 30 days of performance between the US audience and the Canada audience for an America-based e-commerce store. Not only does the US segment show a higher number of total conversions, but it also delivers a stronger conversion rate. This indicates that US visitors are significantly more relevant and engaged, and the brand should prioritize acquiring more traffic from this market.
Understanding your goals performance
Below the main funnel, you’ll find a detailed breakdown of how each of your goals is performing. This table shows you the key metrics associated with your primary conversion goals, helping you understand where your results are coming from.
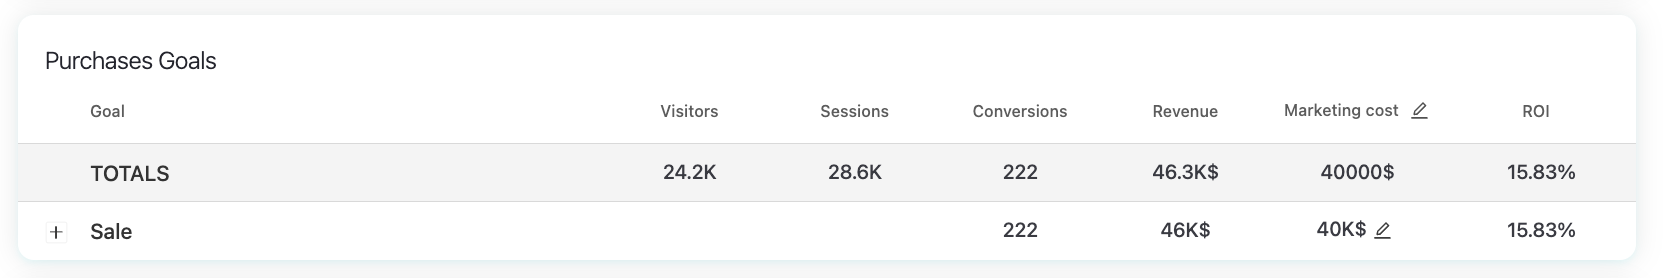
Each row includes:
Visitors – the total number of users who could trigger this goal.
Sessions – the number of sessions associated with this goal.
Conversions – how many times the goal was completed.
Revenue – the total revenue generated from those conversions.
Marketing cost – the amount you spent to acquire the traffic contributing to this goal.
ROI – your return on investment, calculated based on revenue vs. marketing cost.
Exploring conversion paths
The final section of the report focuses on Conversion Paths, which is essentially a breakdown of how users move through your site before they convert. You’ll be able to see:
The different paths visitors followed
How many pages they viewed before converting
How many conversions each path generated
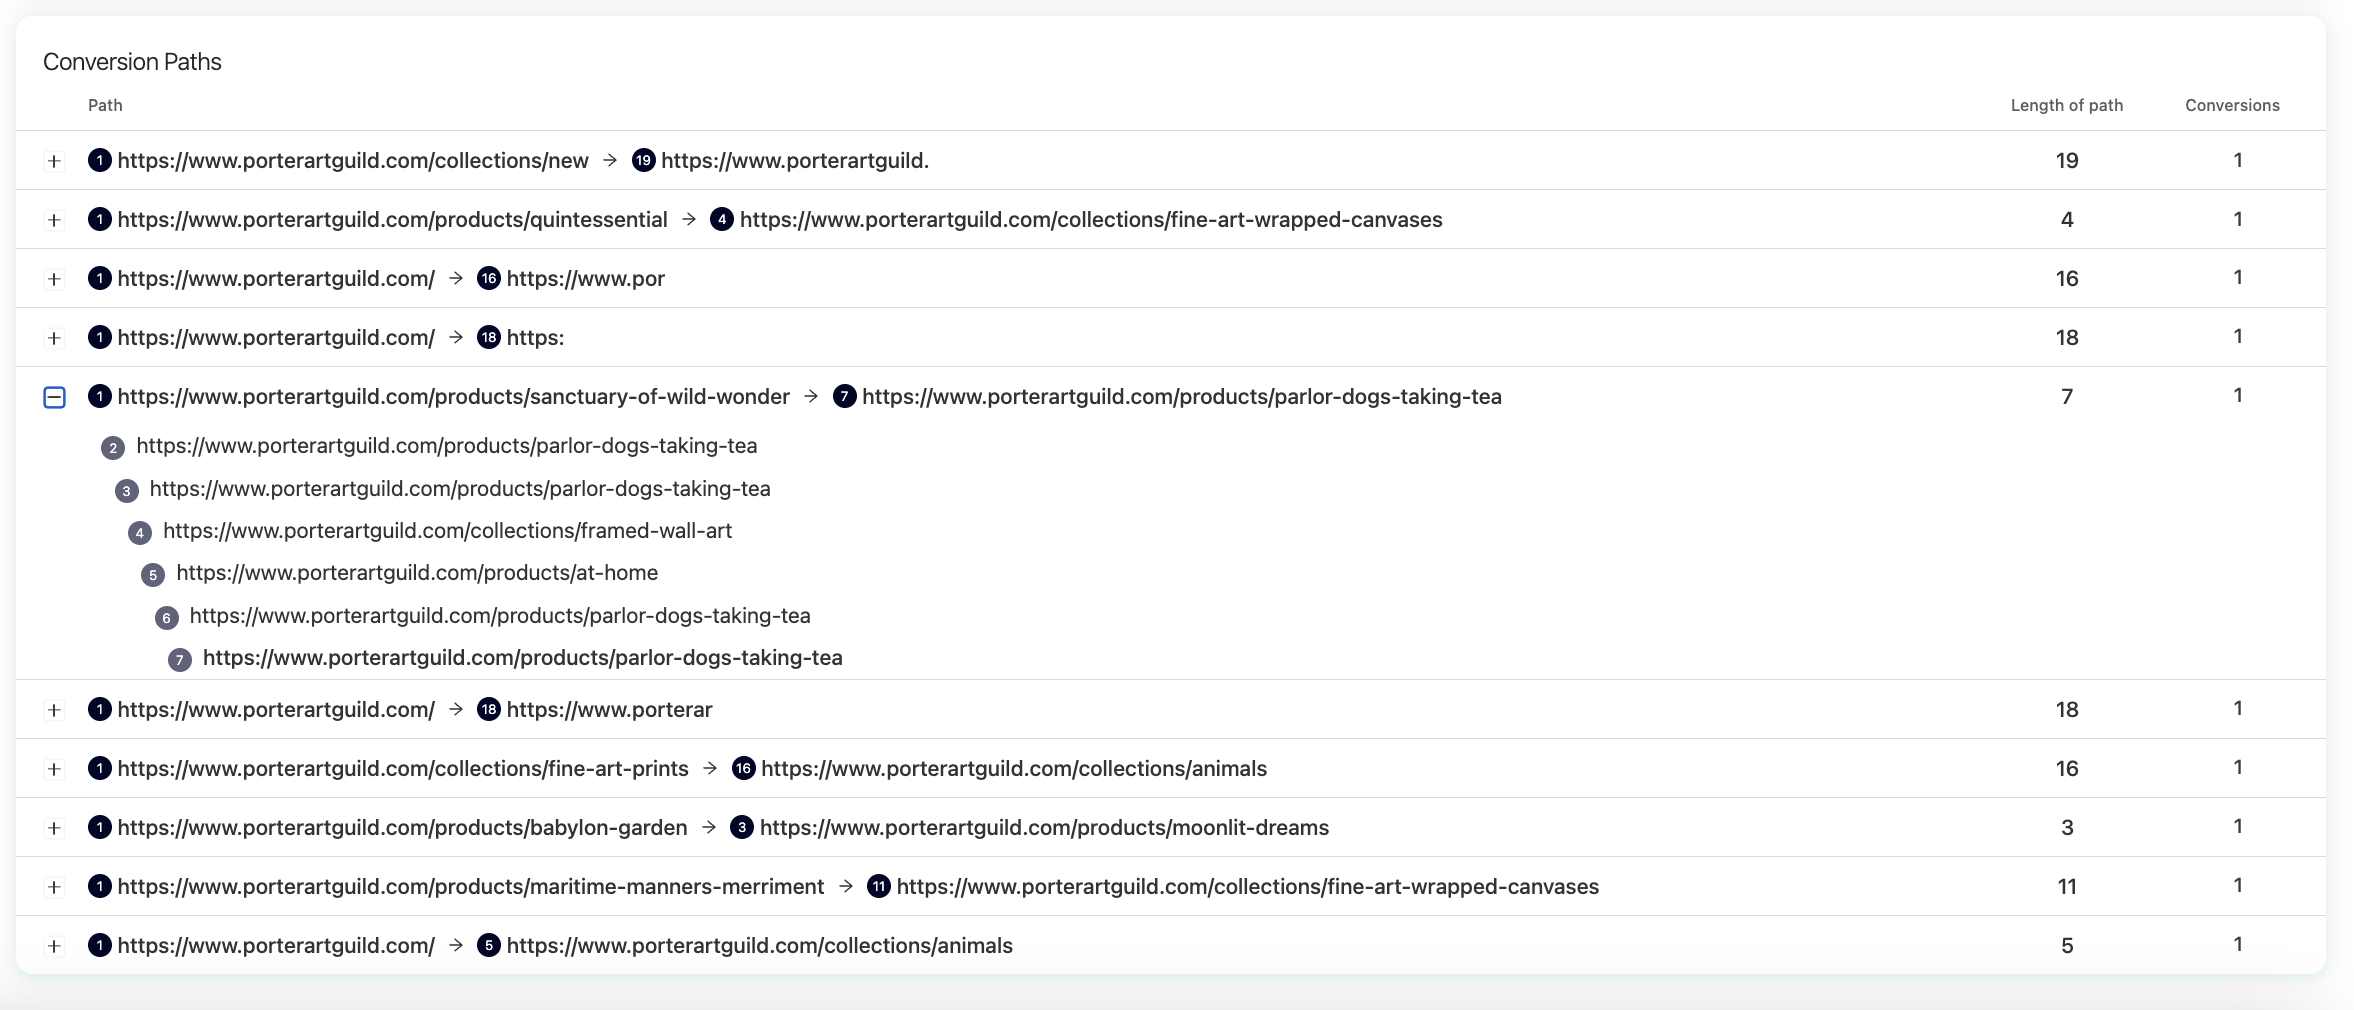
This part of the report helps you understand customer behavior in a deeper way, like what pages influence decisions, how users naturally navigate your site, and what patterns lead them toward making a purchase or completing a goal.
You will see both the length that a customer usually goals trough, meaning the number of pages in the site that they usually visit during their conversion journey, and the number on conversions generated with and without Pathmonk.
Additional features
In the top-right corner of the report, you’ll find the Performance review button:
This enables the double funnel view used for A/B testing and allows you to directly compare performance with and without Pathmonk personalization. Learn more about how to check your Pathmonk results.
How to use this report
Use the Revenue Report to:
See how much revenue your website generates in a given period.
Identify which segments convert best.
Measure ROI by comparing revenue against marketing cost.
Track performance trends over time.
Compare audiences to focus your acquisition efforts.
Understand the path to conversion by reviewing how many visitors and sessions lead to each conversion.
Was this article helpful?
That’s Great!
Thank you for your feedback
Sorry! We couldn't be helpful
Thank you for your feedback
Feedback sent
We appreciate your effort and will try to fix the article