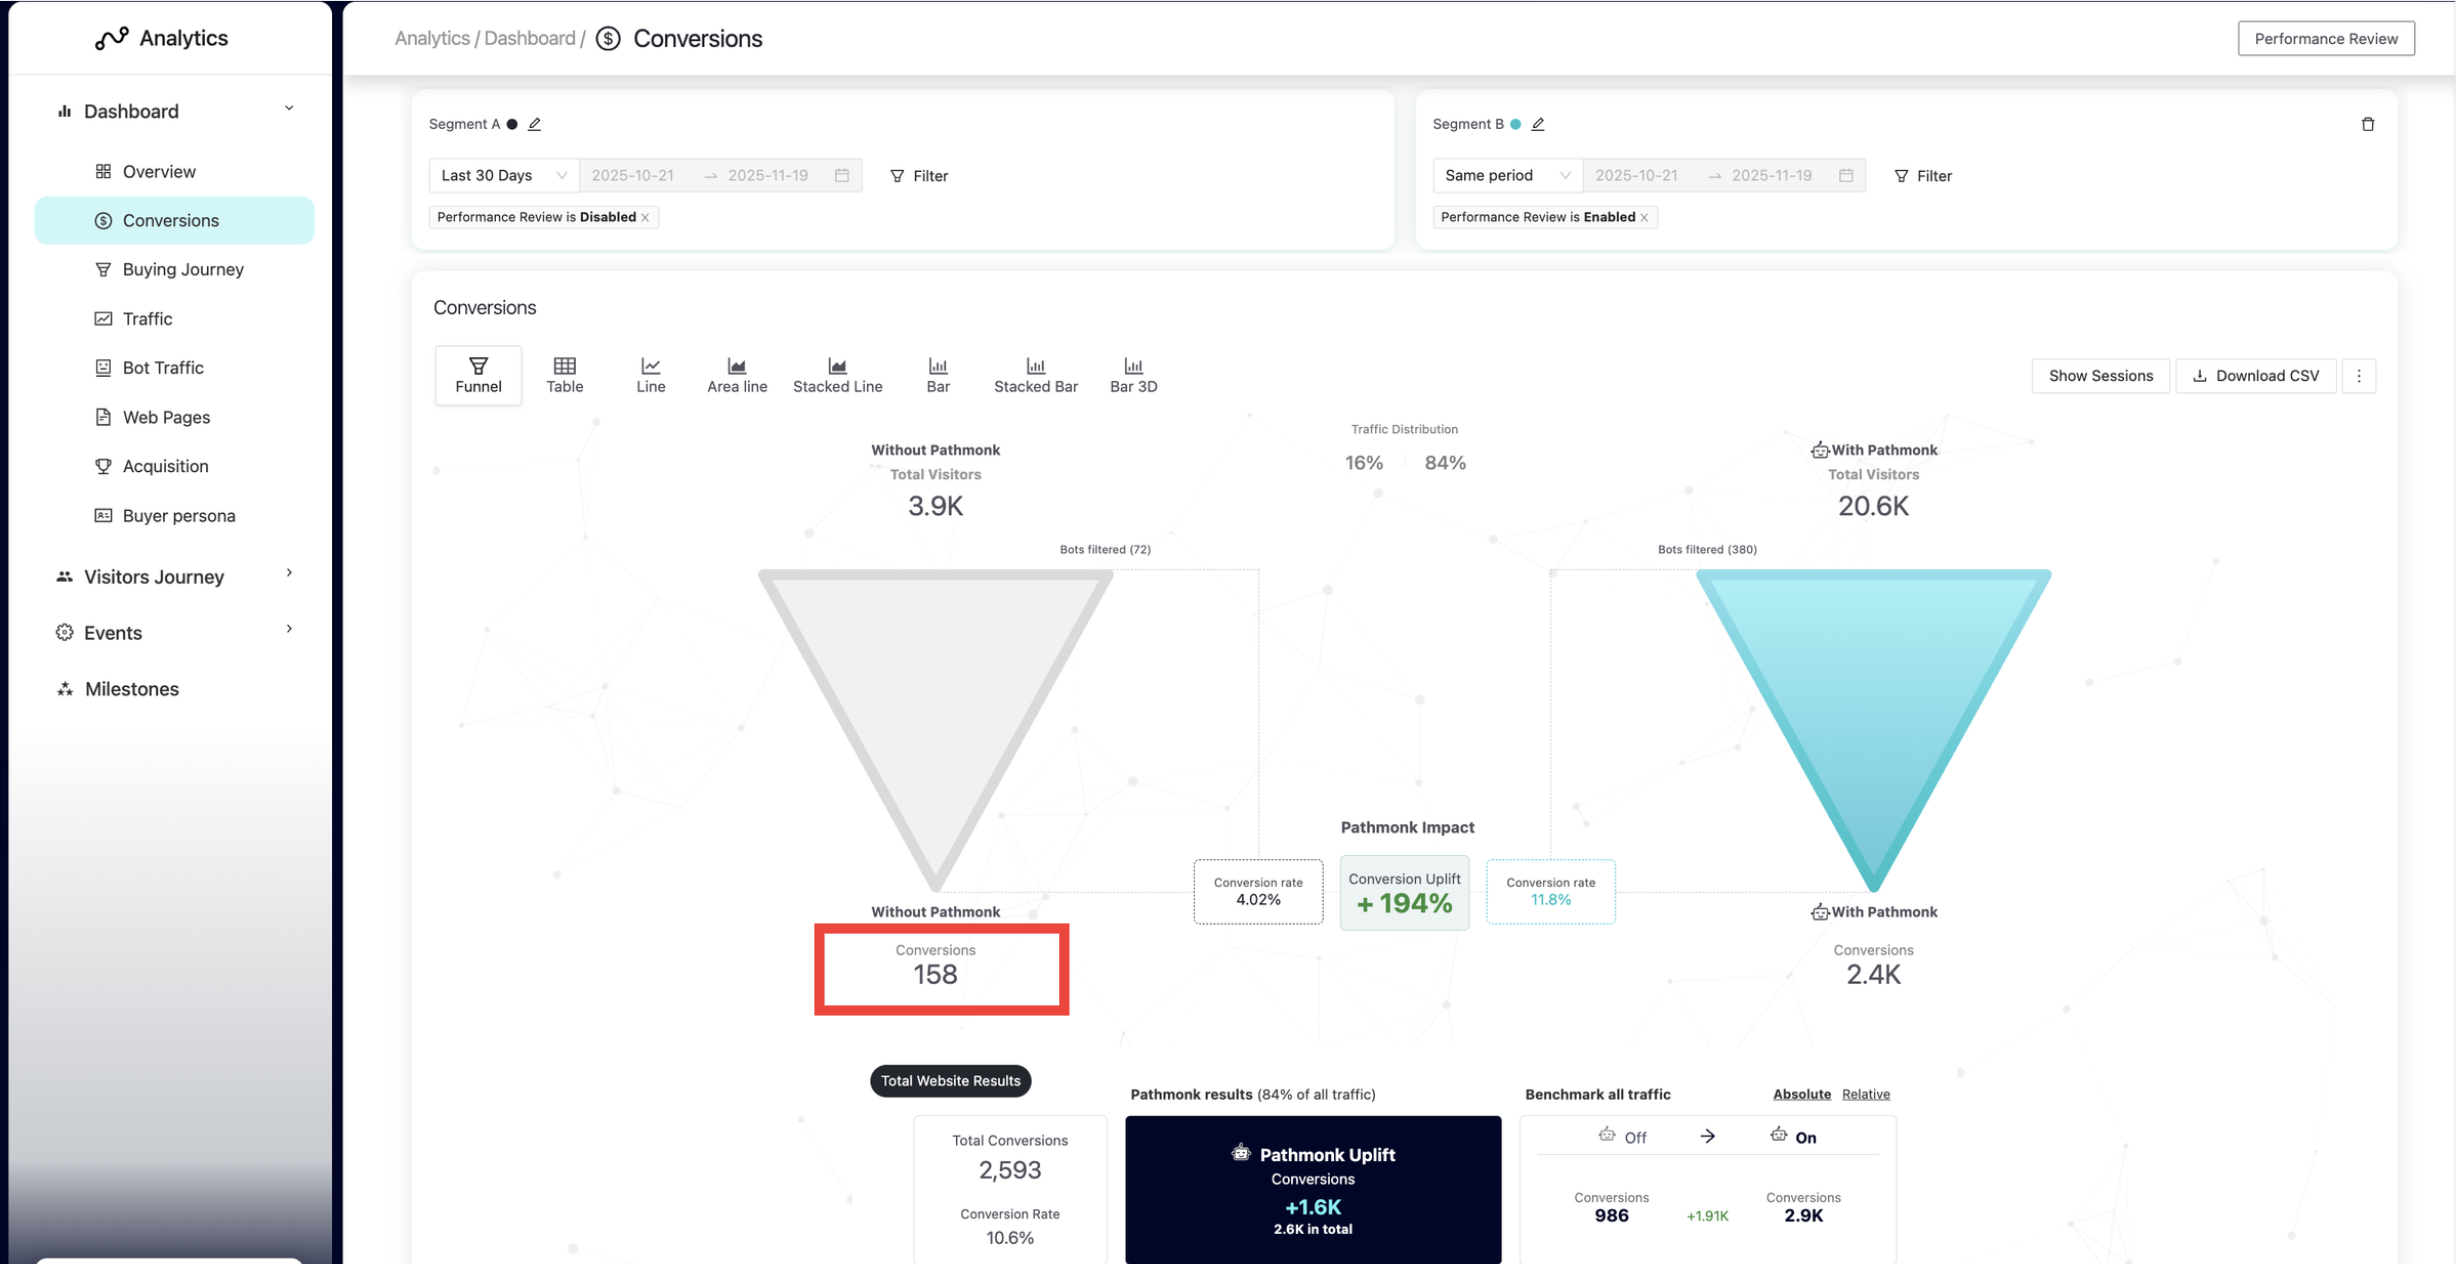
Sometimes you may notice that the number of conversions in the Buying Journey report doesn’t match the conversions in the Revenue report, even when you select the same date range.
For example, in the screenshots below, the Buying Journey report shows 155 conversions for Pathmonk-disabled traffic, while the Revenue report shows 158 conversions for the exact same period. This can look inconsistent at first, but it’s not an error. Each report uses a different attribution logic.
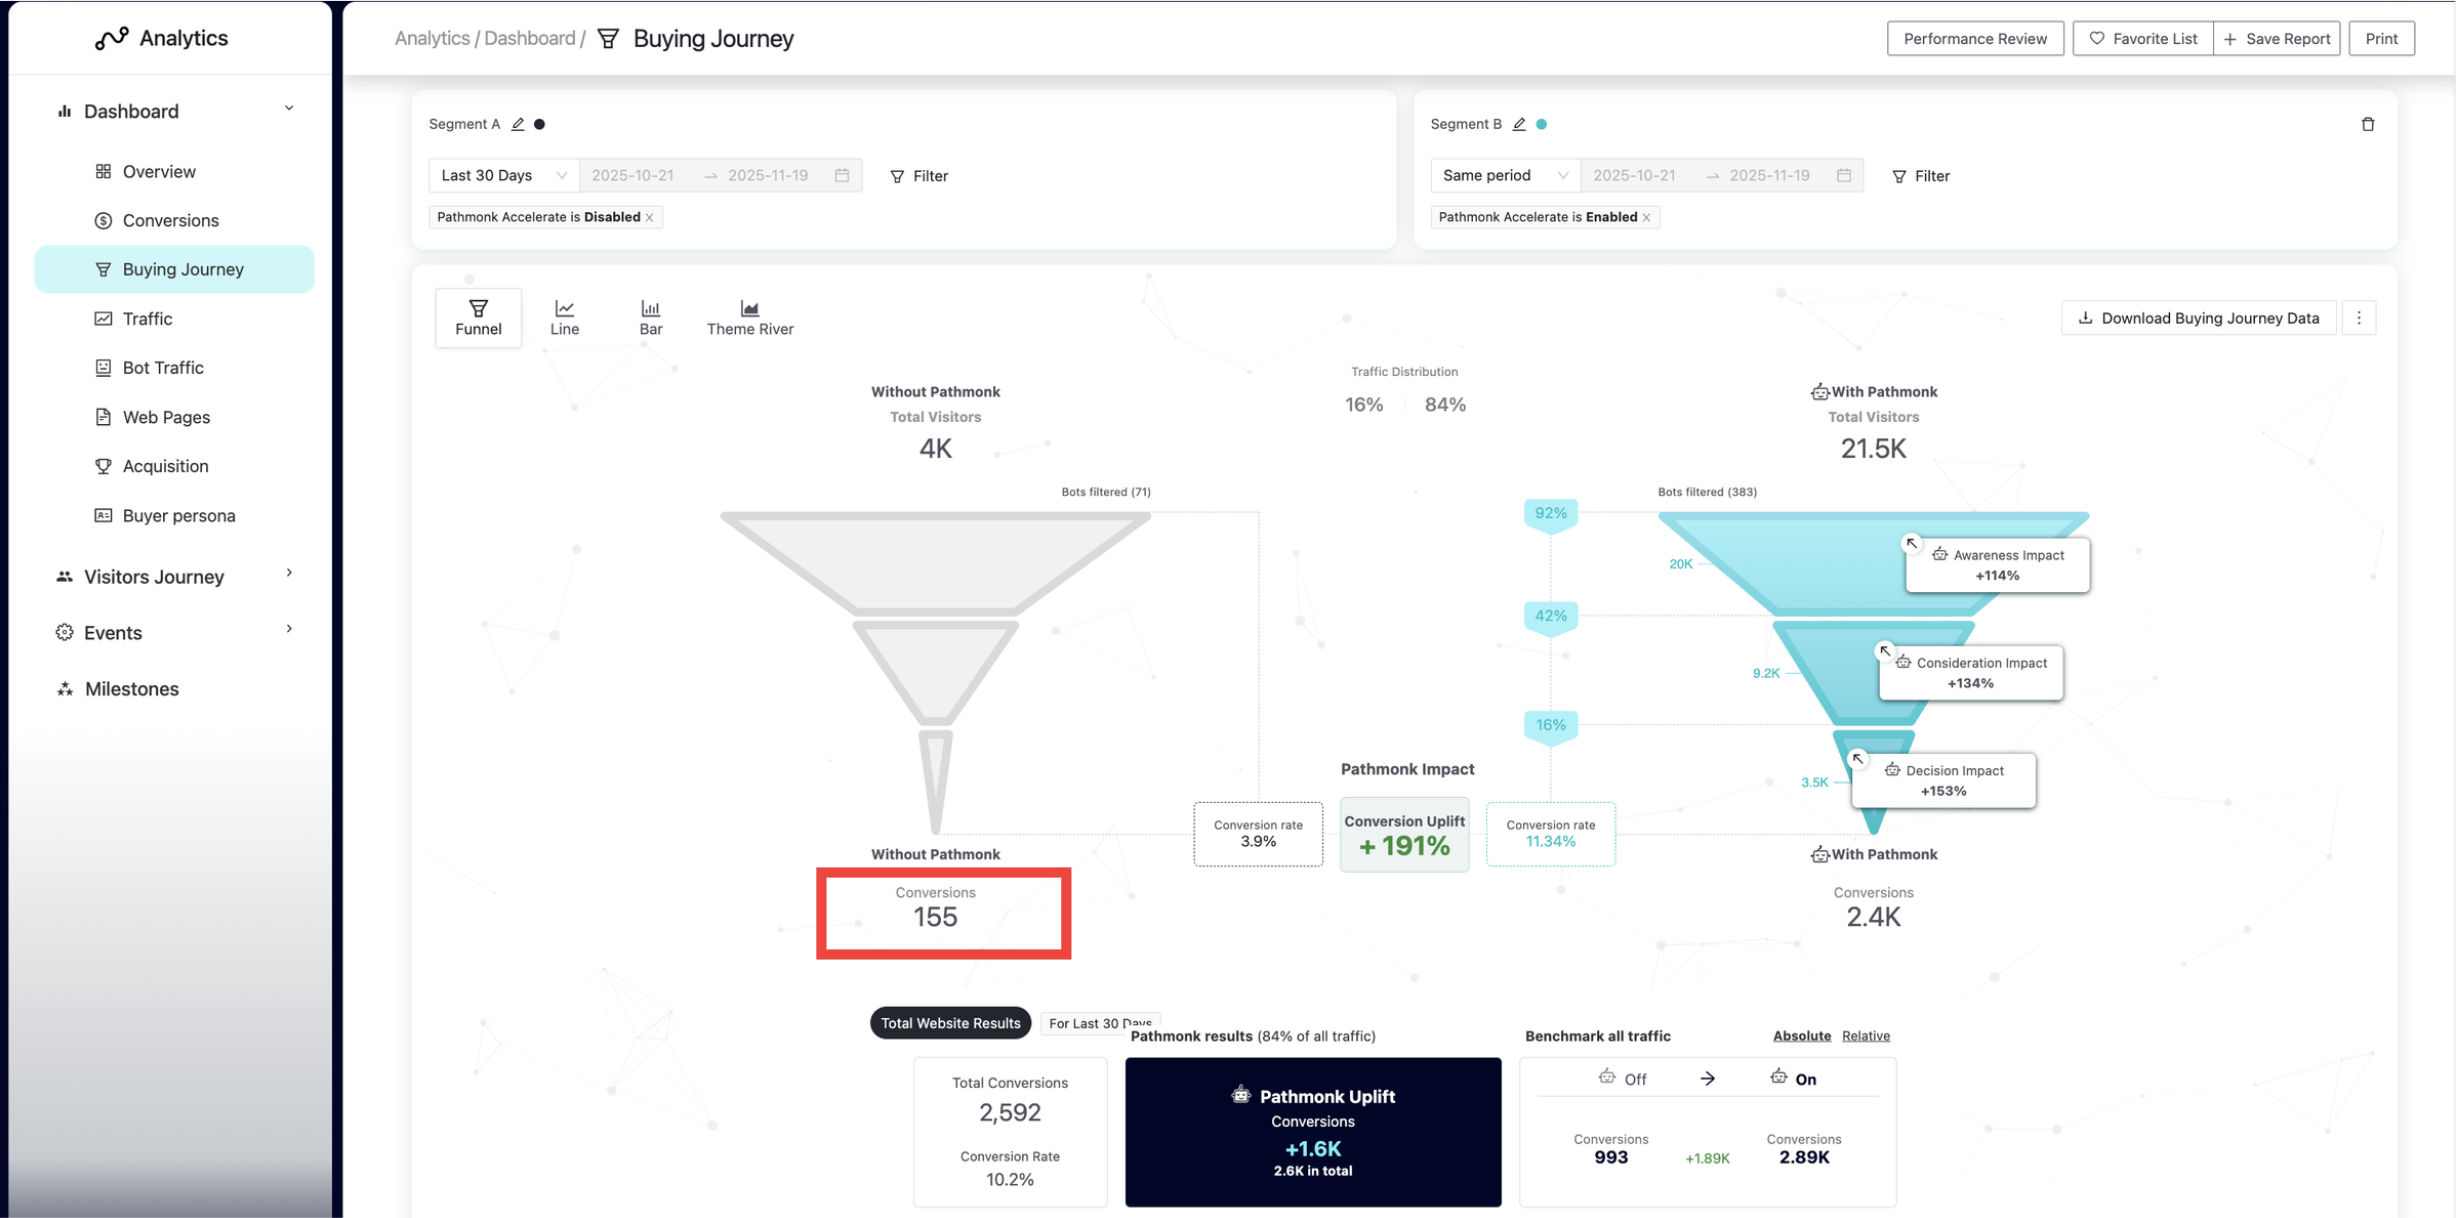
Here’s how each attribution method works so you can understand the difference and interpret your data correctly.
Buying journey: Uses the month of the user’s first visit
The Buying Journey report assigns each conversion to the month when the user first arrived on your website. That first visit creates their fingerprint and marks the beginning of their buying journey. Pathmonk uses this initial visit to group and analyze how converting users enter your funnel over time.
What this means in practice:
If a user first visits your site in November, that user is attributed to November in the Buying Journey.
Even if the actual purchase happens in December, the conversion still appears under November in this report.
If you're measuring something broad like Q4 performance, the conversion will still be included correctly because it happened within the quarter.
But if you're reviewing month-by-month performance, you'll see the conversion counted in November, even though the purchase occurred later.
This report isn’t focused on the purchase date. Instead, it helps you understand when converting users first show up, the month they enter your funnel. It’s designed to reveal acquisition patterns and entry timing, not revenue timing.
Conversion report: Uses the month when the purchase happens
The Conversion report attributes each conversion to the exact date when the purchase is completed, regardless of when the user first visited your website. This report is centered on revenue timing, not user entry timing.
What this means in practice:
If a user completes a purchase in December, the conversion will always be recorded in December, even if their first visit happened weeks or months earlier.
Their full journey (first visit, research, comparison, repeat visits) does not affect where the conversion appears in this report.
This view reflects your true sales volume per month, which is what most teams use for financial reporting, revenue tracking, monthly performance reviews, and forecasting.
The Conversion report gives you a clean view of when money actually comes in, making it the right source of truth for monthly and quarterly revenue analysis.
Why these differences exist
Each report serves a different purpose:
The Buying Journey highlights when converting users first arrive, helping you understand acquisition trends.
The Conversion Report shows when revenue is actually generated, which is essential for monthly performance and financial tracking.
In short
Buying journey report → month when the journey begins
Conversion report → month of the purchase
Was this article helpful?
That’s Great!
Thank you for your feedback
Sorry! We couldn't be helpful
Thank you for your feedback
Feedback sent
We appreciate your effort and will try to fix the article