The Acquisition Report shows where your conversions come from and how each traffic source contributes to your revenue. It helps you understand which channels bring high-intent visitors, which campaigns convert best, and where to focus your marketing budget.
To access this report, click on your Analytics top tab, open Analytics Dashboard, and select Acquisition.
What you can see in this report
The Acquisition report is divided into several tabs so you can analyze your conversions from different angles. Each tab groups your conversions by a different type of acquisition source, but all of them show the same core metrics so you can compare performance consistently.
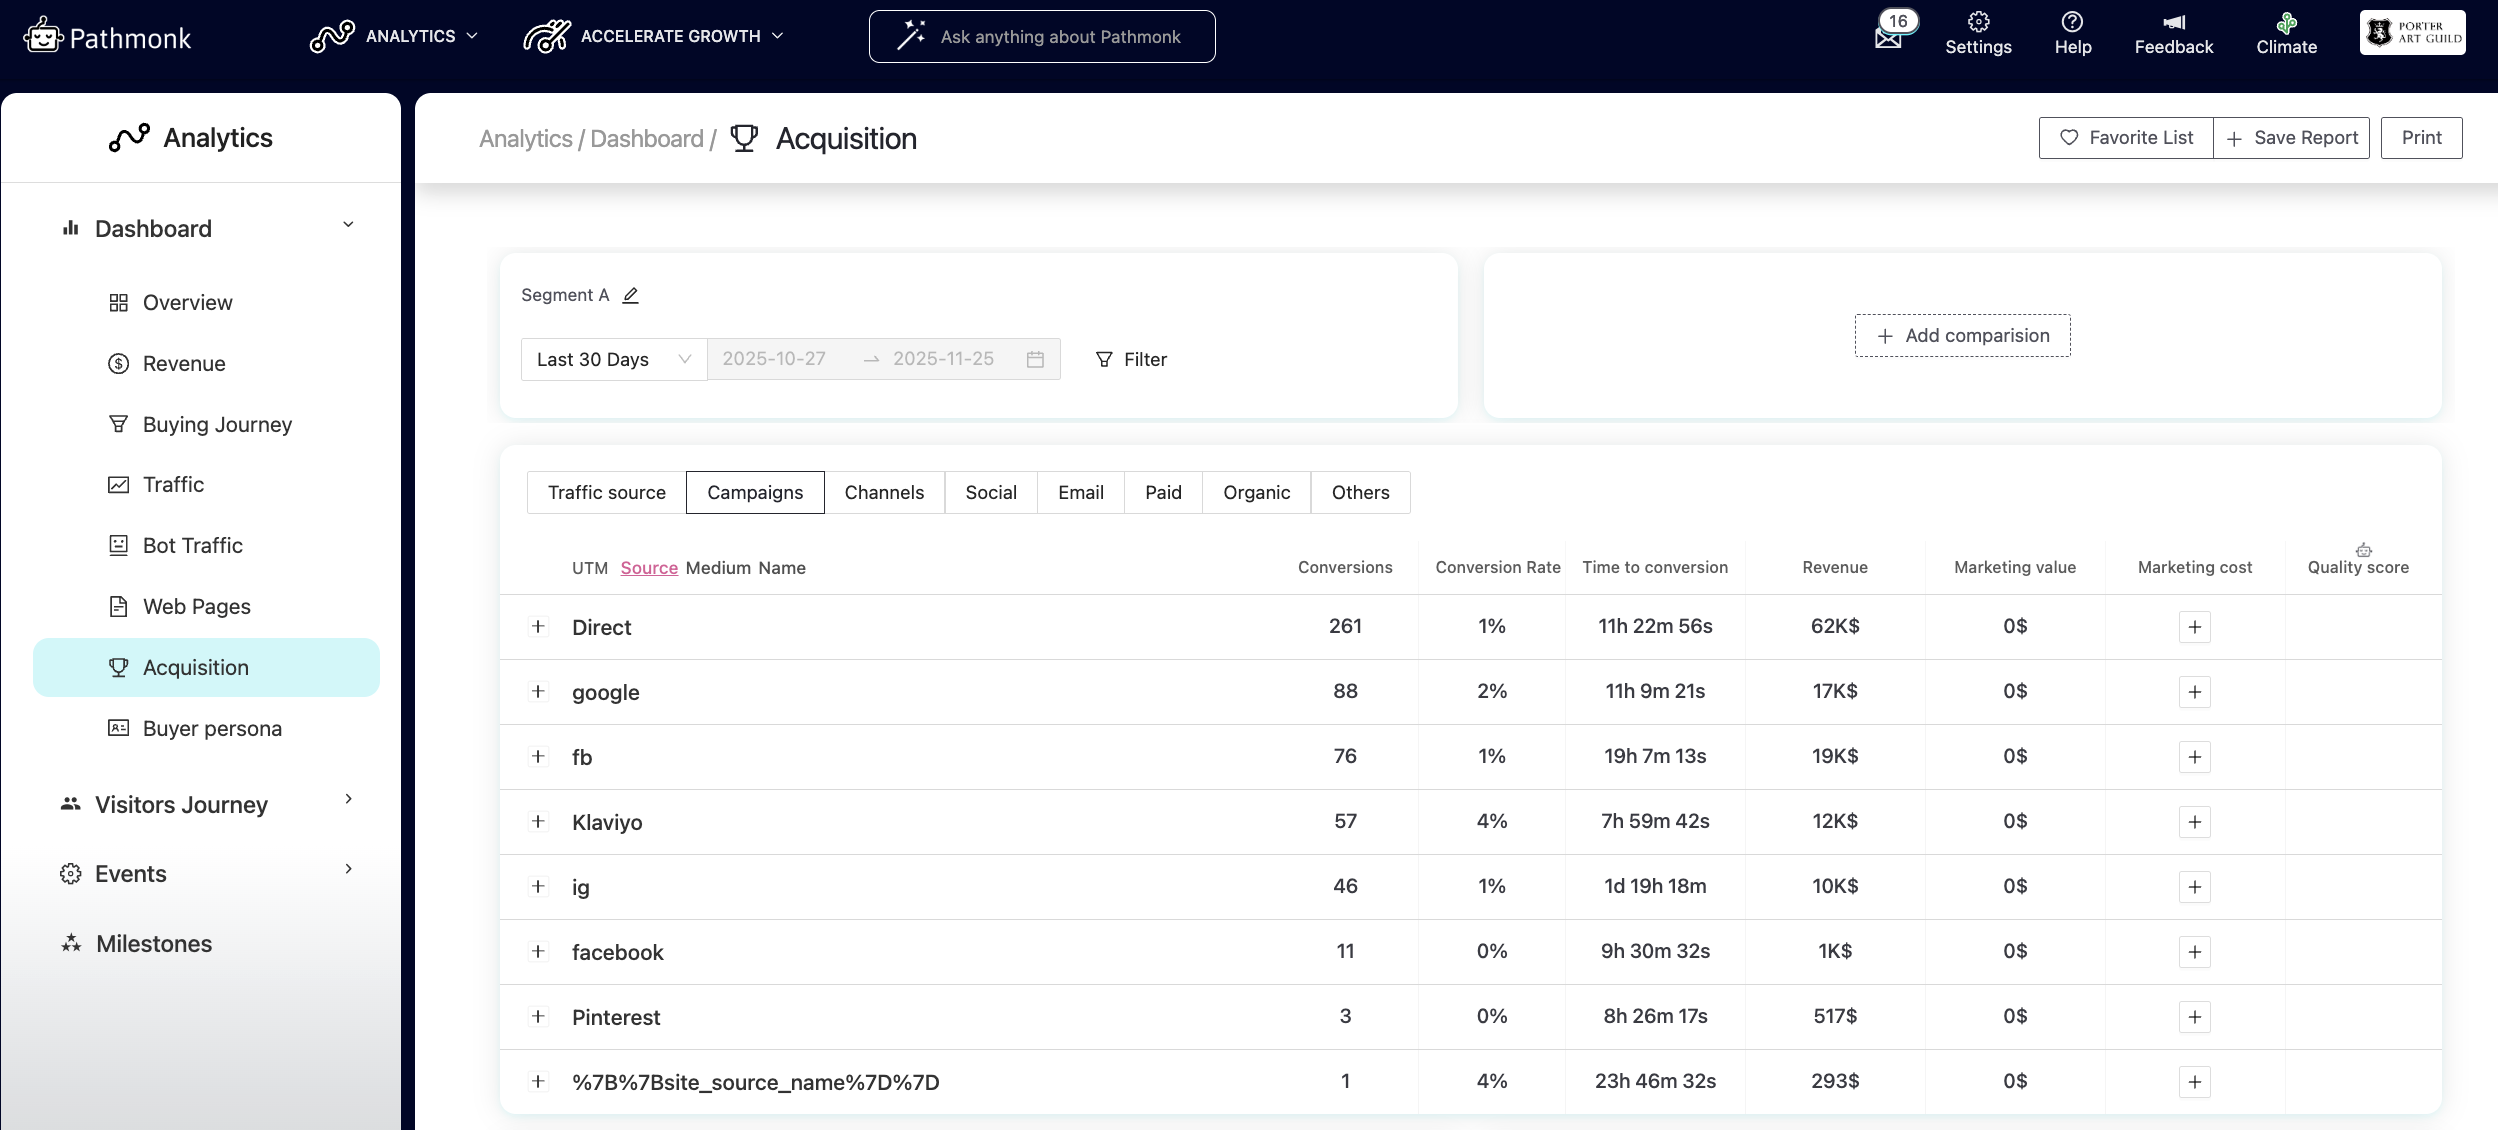
Across all tabs, you will see:
Conversions – how many conversions came from this source.
Conversion rate – percentage of visitors who converted.
Time to conversion – the average time it takes for visitors from that source to convert.
Revenue – total revenue attributed to that source.
Marketing value – estimated value of the source based on your filters.
Marketing cost – optional field to enter your spend and calculate ROI.
Quality score – Pathmonk’s scoring of traffic relevancy and intent.
The tabs included in the report are:
Traffic source — groups conversions by UTM Source (or Direct/Unknown if UTMs aren’t present).
Campaigns — shows performance by UTM Campaign.
Channels — groups conversions into standard marketing channels like Direct, Social, Paid, Organic, Email, and Referral.
Social, Email, Paid, Organic, Others — category-specific views that help you drill down into performance within a single channel type.
This structure allows you to analyze acquisition from the highest level (Channels) down to the most detailed level (specific campaigns or sources), all while comparing the same set of metrics.
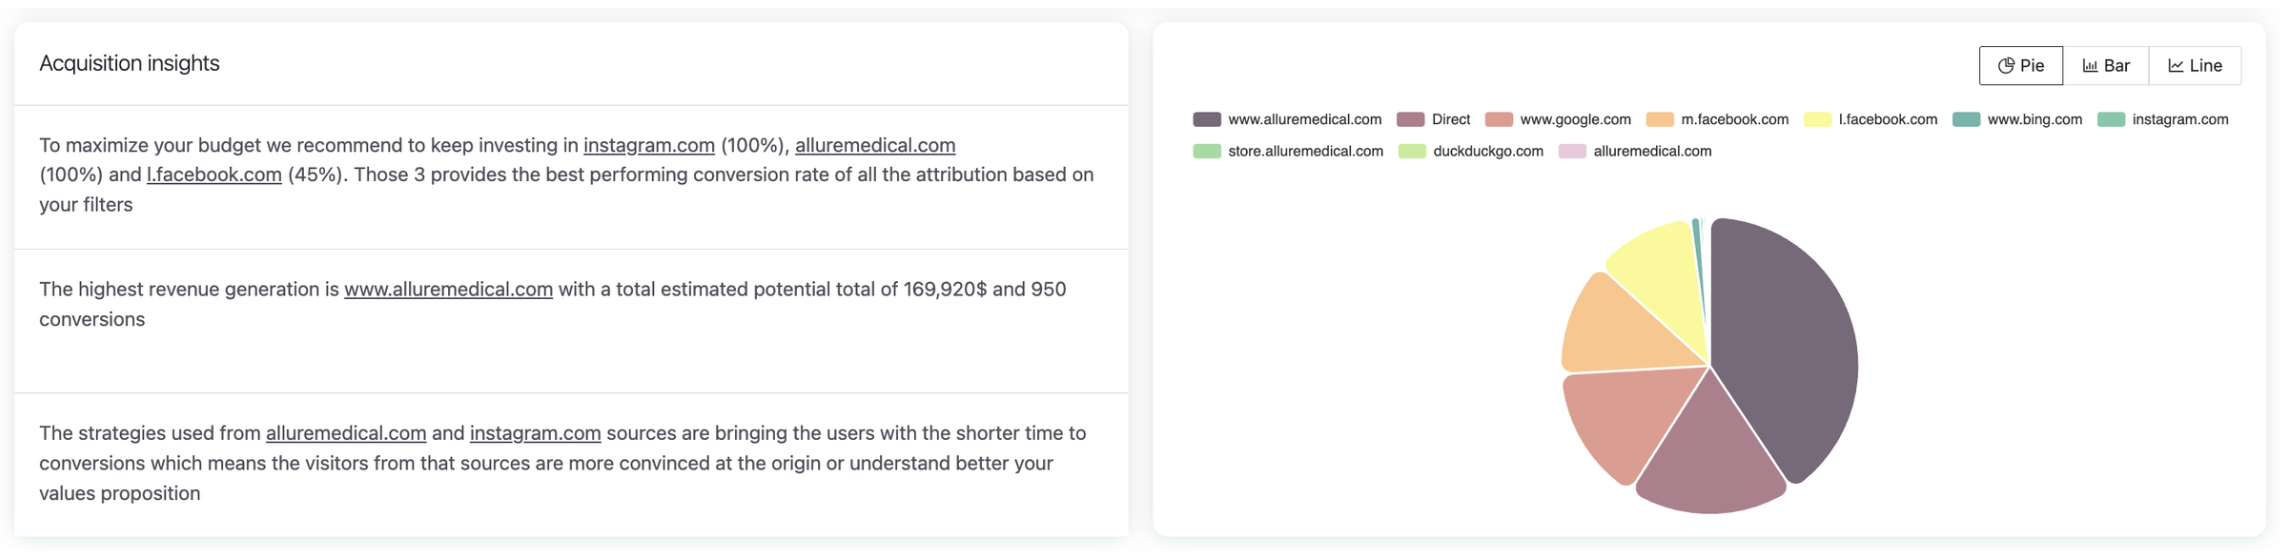
Acquisition insights
At the bottom of the report, you’ll find Acquisition insights, automated observations that highlight the most relevant learnings from the analyzed period.
These insights include:
Key takeaways: Metrics that stand out due to their impact or change.
Top performing strategies: Patterns or tactics that consistently deliver strong results.
Dynamic visualizations: Charts that update depending on the selected source, helping you quickly spot which traffic channels offer the best conversion opportunities.
The main value of the report lies in its ability to highlight both opportunities and challenges in your acquisition strategy. For example, you might discover that a Meta campaign is consuming a large portion of your budget but only contributing a small share of conversions, but with this insight, you can redirect resources toward more profitable channels or adjust the underperforming campaign.
This information is essential for optimizing your budget, strengthening the most effective sources, and improving the overall quality of your incoming traffic.
How to use this report
Use the Acquisition report to:
Identify which sources drive the highest number of conversions.
Compare campaign performance to see where to allocate budget.
Understand which channels generate the most revenue.
Spot sources with fast time-to-conversion (high buying intent).
Evaluate the quality of traffic coming from paid or organic campaigns.
Was this article helpful?
That’s Great!
Thank you for your feedback
Sorry! We couldn't be helpful
Thank you for your feedback
Feedback sent
We appreciate your effort and will try to fix the article