The Buying Journey report gives you a complete view of how visitors move through your website, from awareness to conversion. It’s one of the most useful reports in the Analytics section, helping you understand where users drop off, how many reach each stage of the journey, and what your overall conversion rate looks like.
To access the report, click on your Analytics top tab, then open Analytics Dashboard, and select Buying Journey.
What you can see in this report
When you open the Buying Journey report, you’ll see a funnel that represents your website traffic segmented into four key stages:
Awareness – visitors who land on your site and start exploring.
Consideration – users who visit multiple pages or show clear interest.
Decision – visitors who reach conversion-related pages or actions.
Conversions – users who complete your main goal (e.g., demo booked, signup, or purchase).
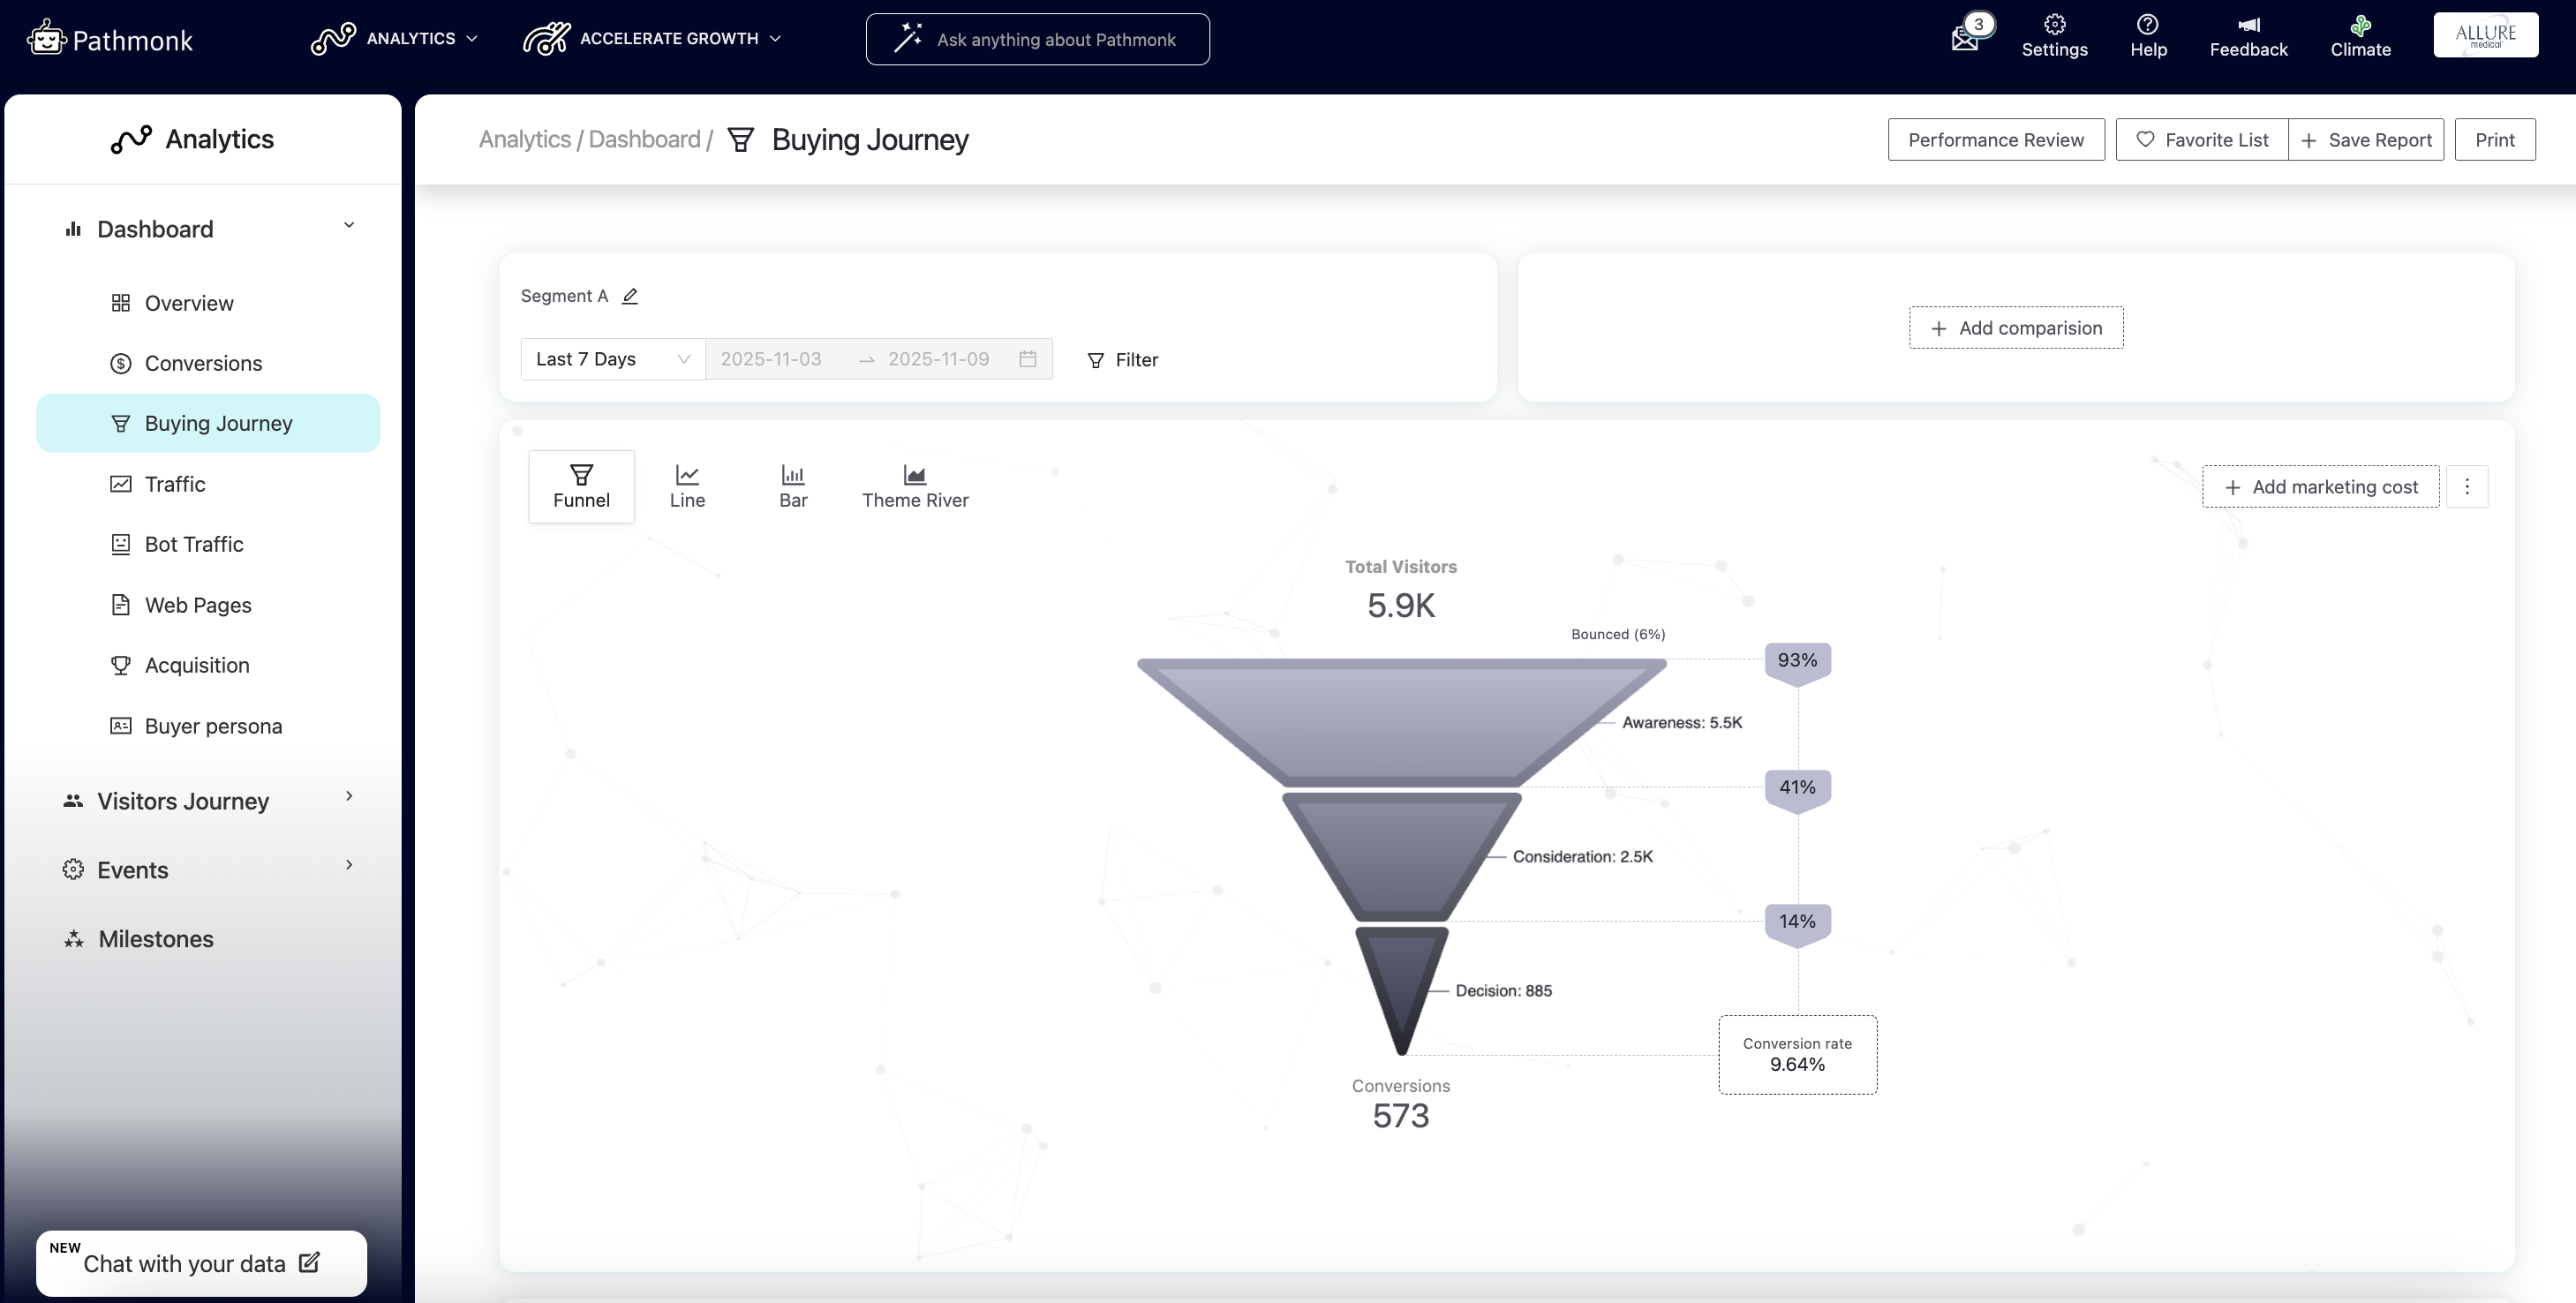
Each section of the funnel shows both absolute numbers and conversion percentages between stages, so you can quickly identify where users drop off or where performance is improving.
Adjusting the date range
You can select the period you want to analyze by using the date filter above the funnel.
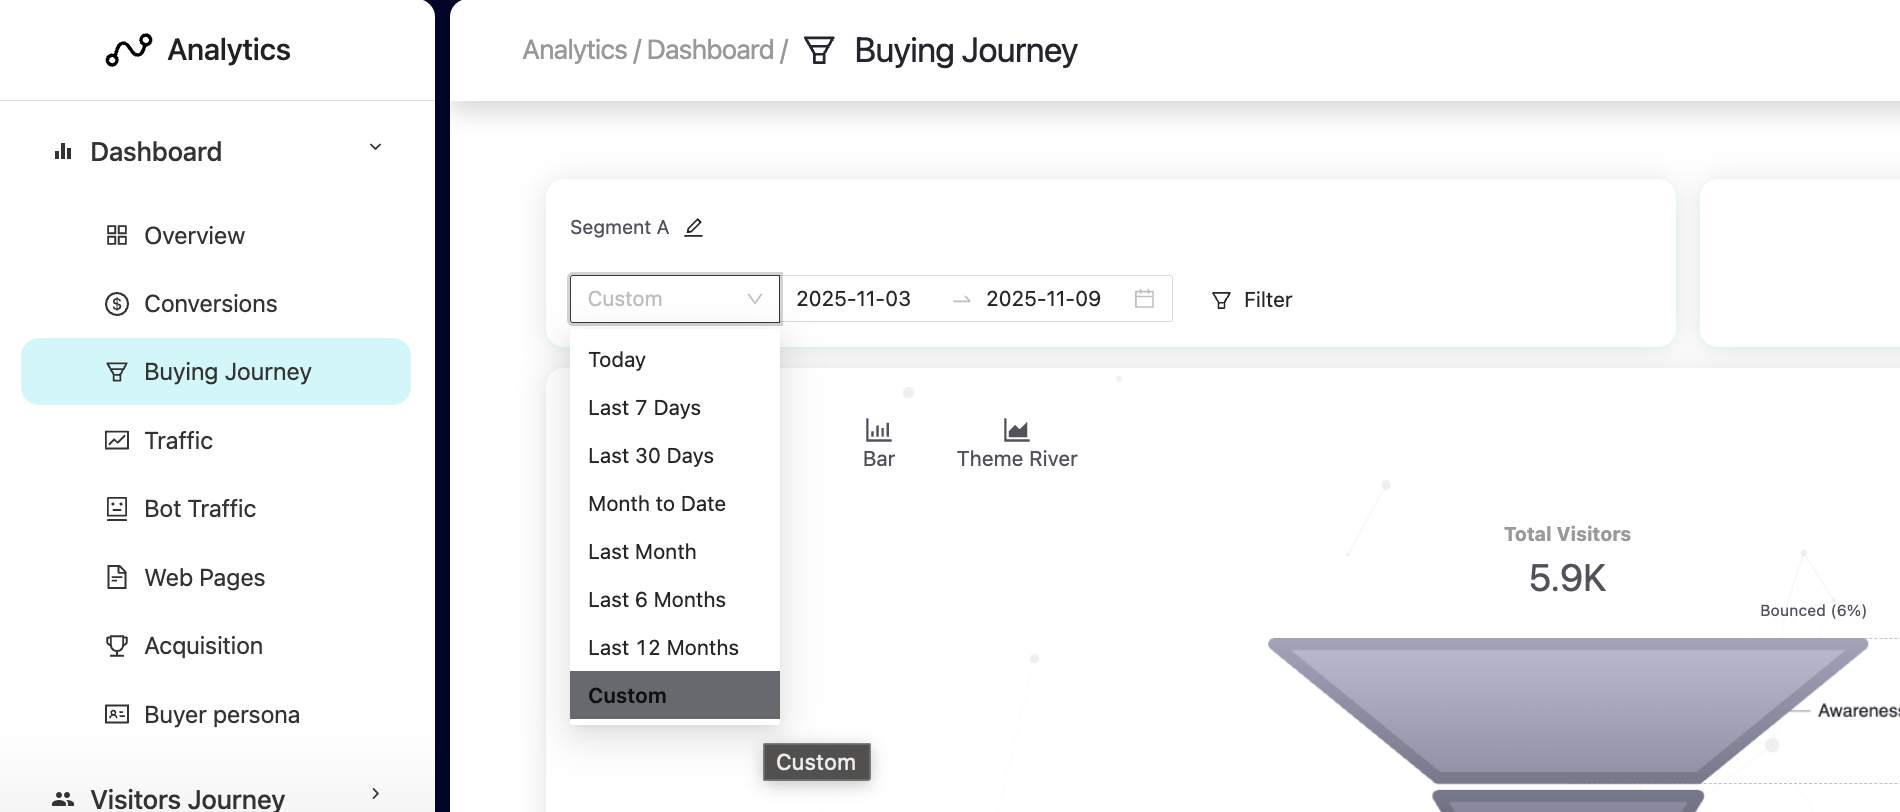
This flexibility allows you to track short-term campaign performance or analyze long-term conversion trends.
Comparing two segments using filters
The Buying Journey report also lets you compare two different segments side by side: Segment A and Segment B. You can use this to compare:
Two different time periods (for example, last month vs. previous month).
Two traffic sources or campaigns (for example, Google Ads vs. Facebook).
Two audience segments based on UTM, referral, device, or country.
To do this, define Segment A and Segment B at the top of the page. In the example below, we're comparing the traffic for the last 30 days coming from their Google campaigns to that coming from ChatGPT.
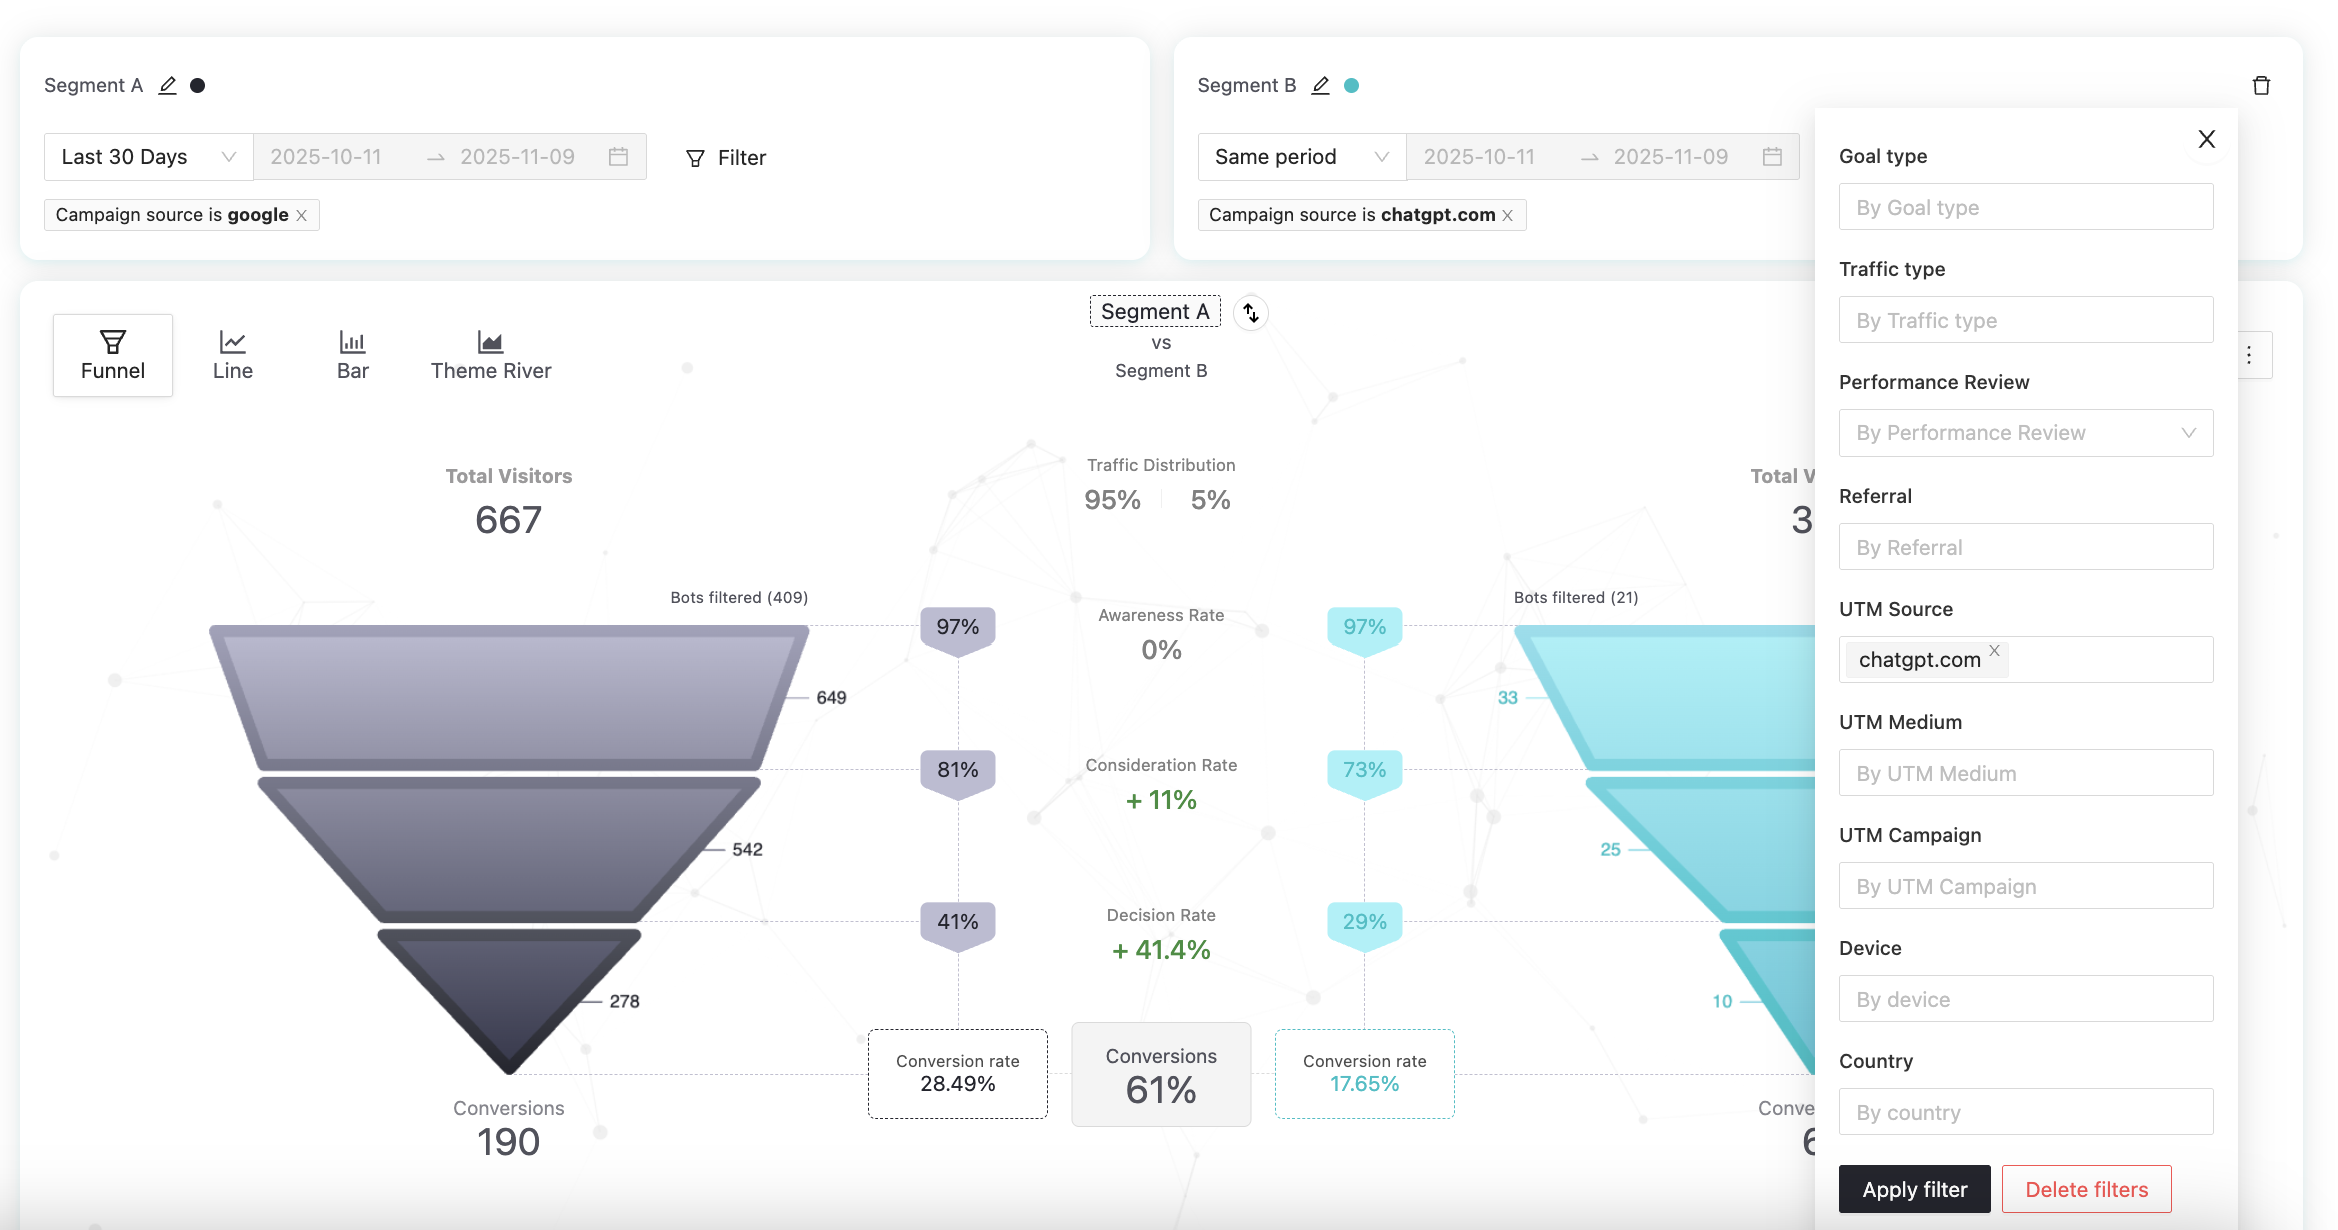
The system will display both funnels side by side, showing total visitors, conversion rates per stage, and uplift or decrease percentages between the two segments.
Evaluation metrics
Below the main funnel, the Evaluation section summarizes key metrics for your buying journey. You’ll see:
Conversion rate
Decision rate
Consideration rate
Awareness rate
Bounce rate
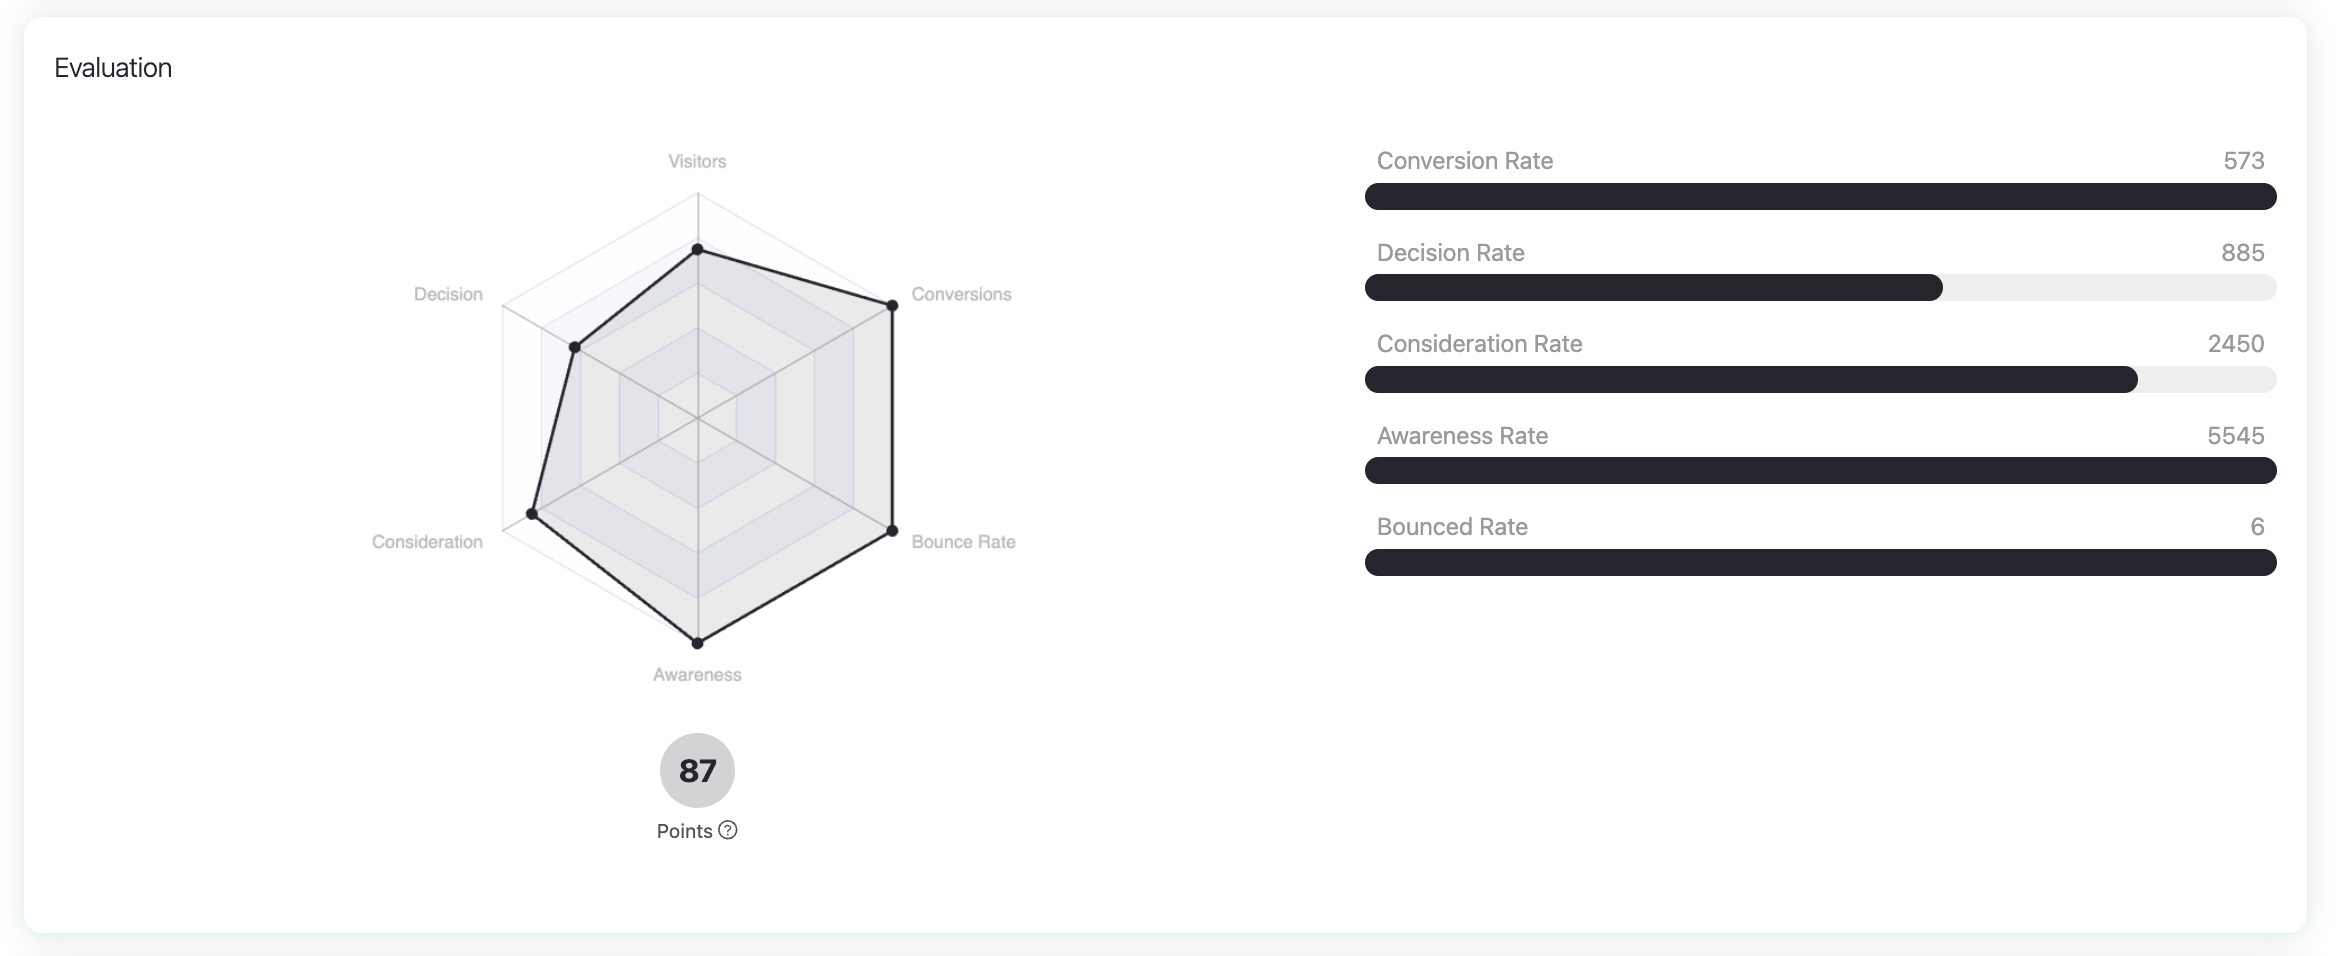
These metrics are displayed both as numerical values and in a radar chart, giving you a visual sense of how balanced your buying journey is. The Points score summarizes overall journey health at a glance.
Buying Journey details
Scroll down to the Buying Journey Details table to see a breakdown by traffic source. You can filter by:
Campaigns
Social
Email
Paid
Organic
Others
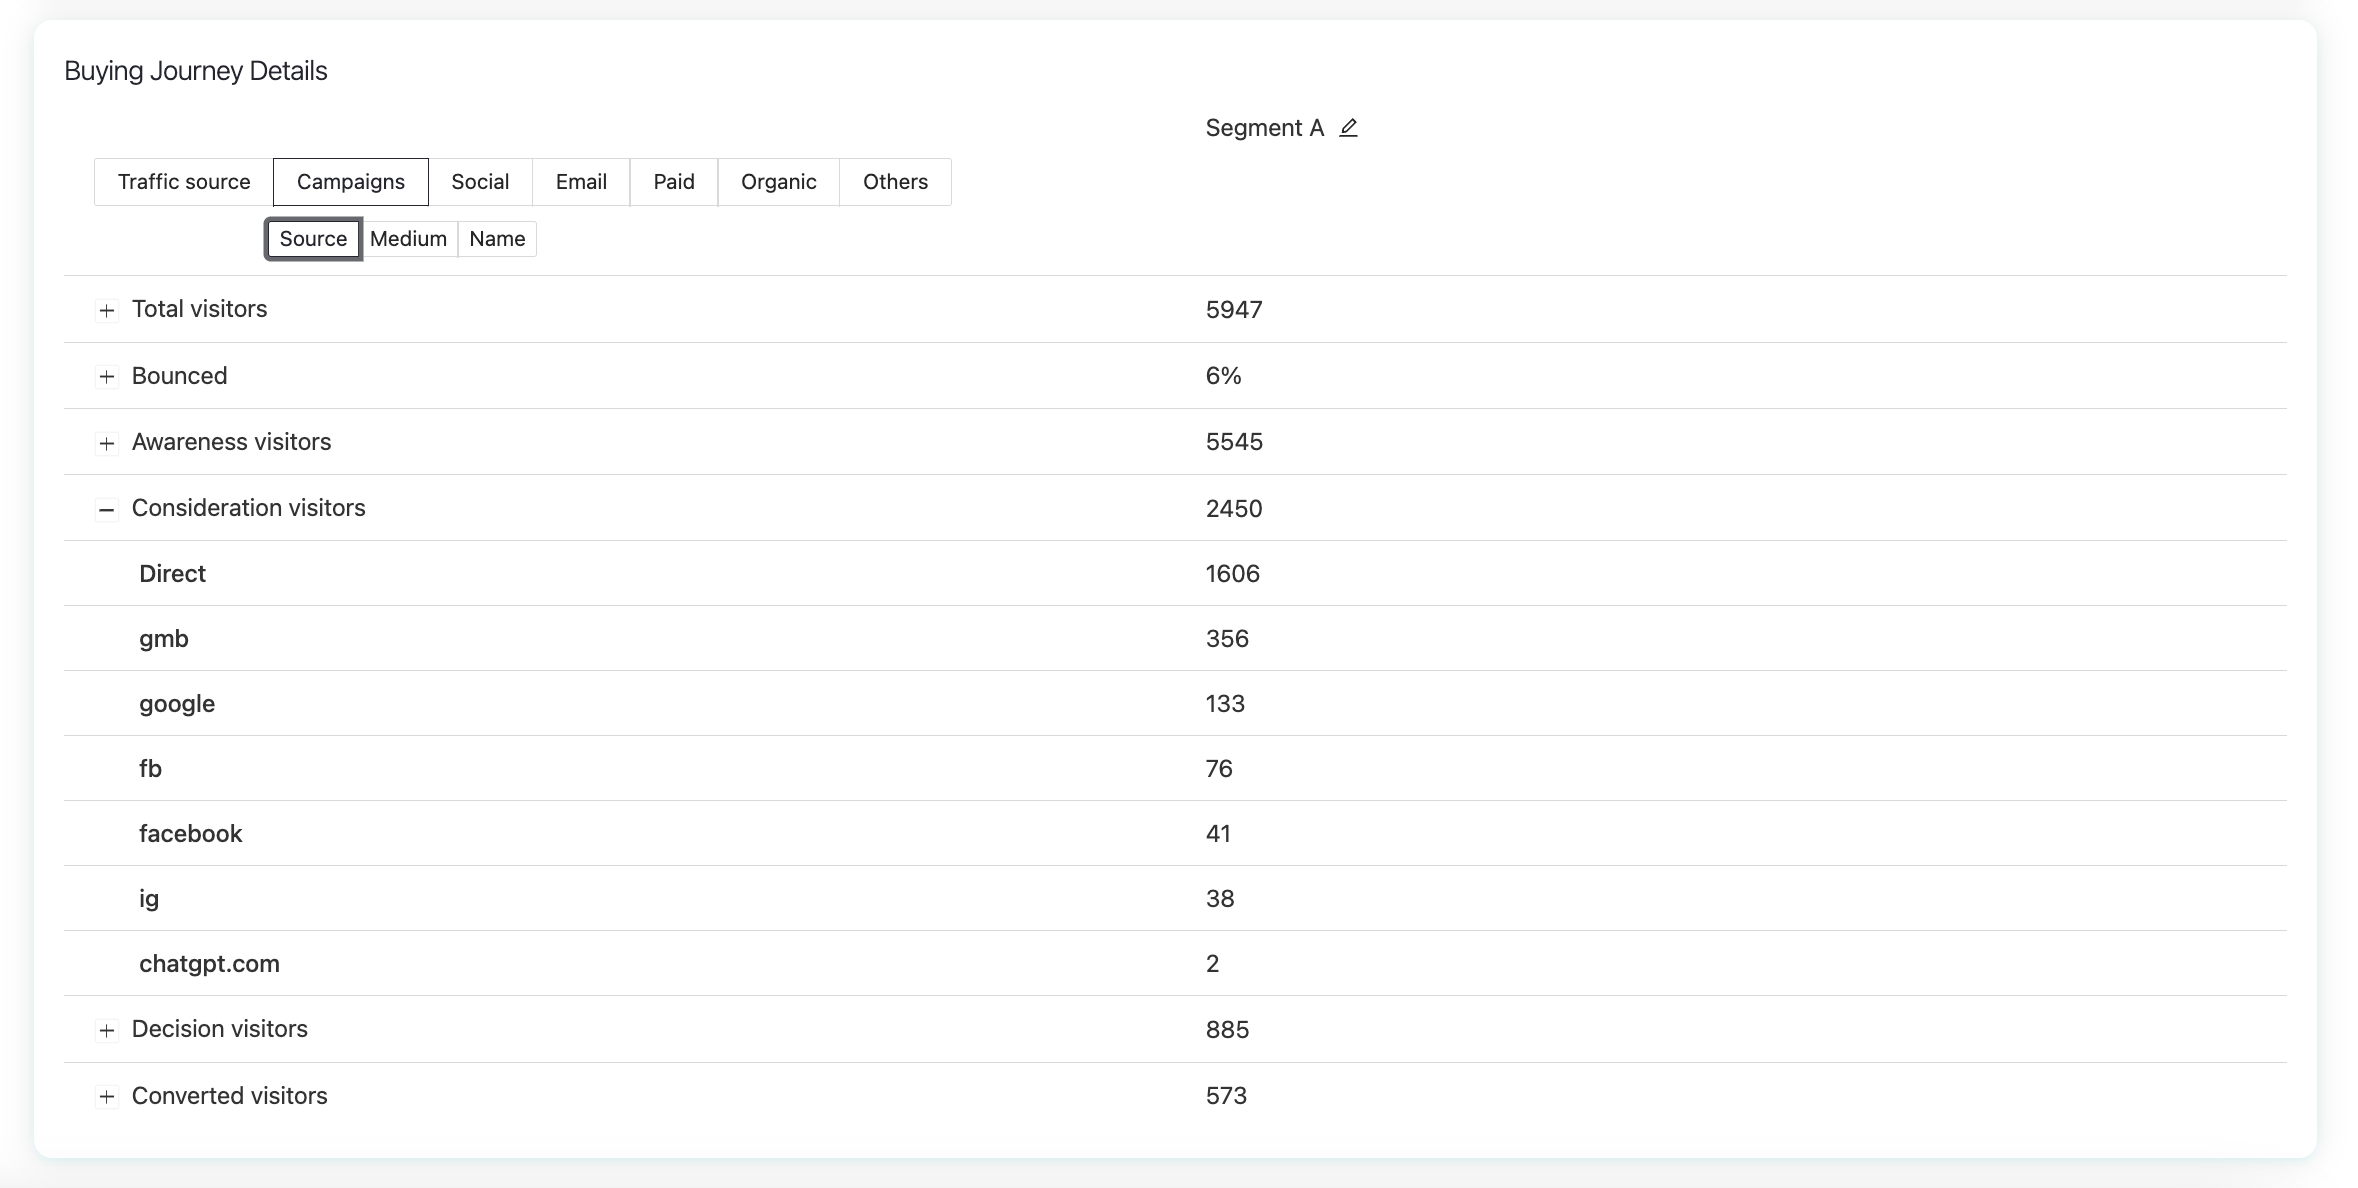
Within Campaigns, you can also view data by source, medium, or name, to understand how visitors behave across stages (awareness, consideration, decision, and conversion).
This section helps you identify which sources drive the most qualified users through the journey, not just which bring the most traffic.
Additional features
In the top-right corner of the report, you’ll find several options:
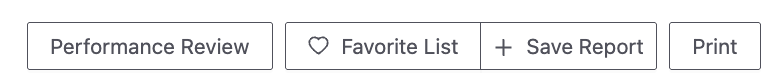
Performance Review → enables the double funnel view used for A/B testing. This allows you to directly compare performance with and without Pathmonk personalization. Learn more about how to check your Pathmonk results.
Save Report / Print → allows you to export or share the report easily.
In the top-right corner of the funnel, you'll also see:
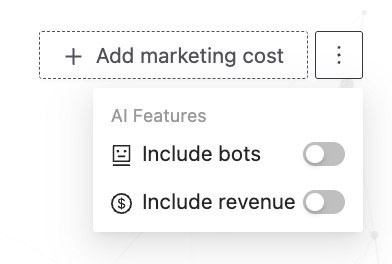
Add marketing cost → lets you include your campaign costs to calculate performance in terms of ROI.
Include bots / Include revenue toggles → under the three-dot menu, you can choose whether to display bot traffic and revenue data in your report.
How to use this report
Use the Buying Journey report to:
Identify which stage of the funnel loses the most visitors.
Compare different sources to see which traffic converts best.
Validate whether Pathmonk’s personalization improves conversion rates.
Track changes over time to measure the effect of campaigns or UX updates.
Was this article helpful?
That’s Great!
Thank you for your feedback
Sorry! We couldn't be helpful
Thank you for your feedback
Feedback sent
We appreciate your effort and will try to fix the article