If you’d like to understand how your visitors and conversions are distributed across devices, you can easily filter any Pathmonk report by device type.
Step 1: Open any report and select the filter options
Go to the report you want to analyze. At the top of the chart, on the left-hand side, you’ll see the date range selector. Right next to it, you’ll find the Filter button.
Once you click on it, a panel will appear with the different filtering options available for that report.
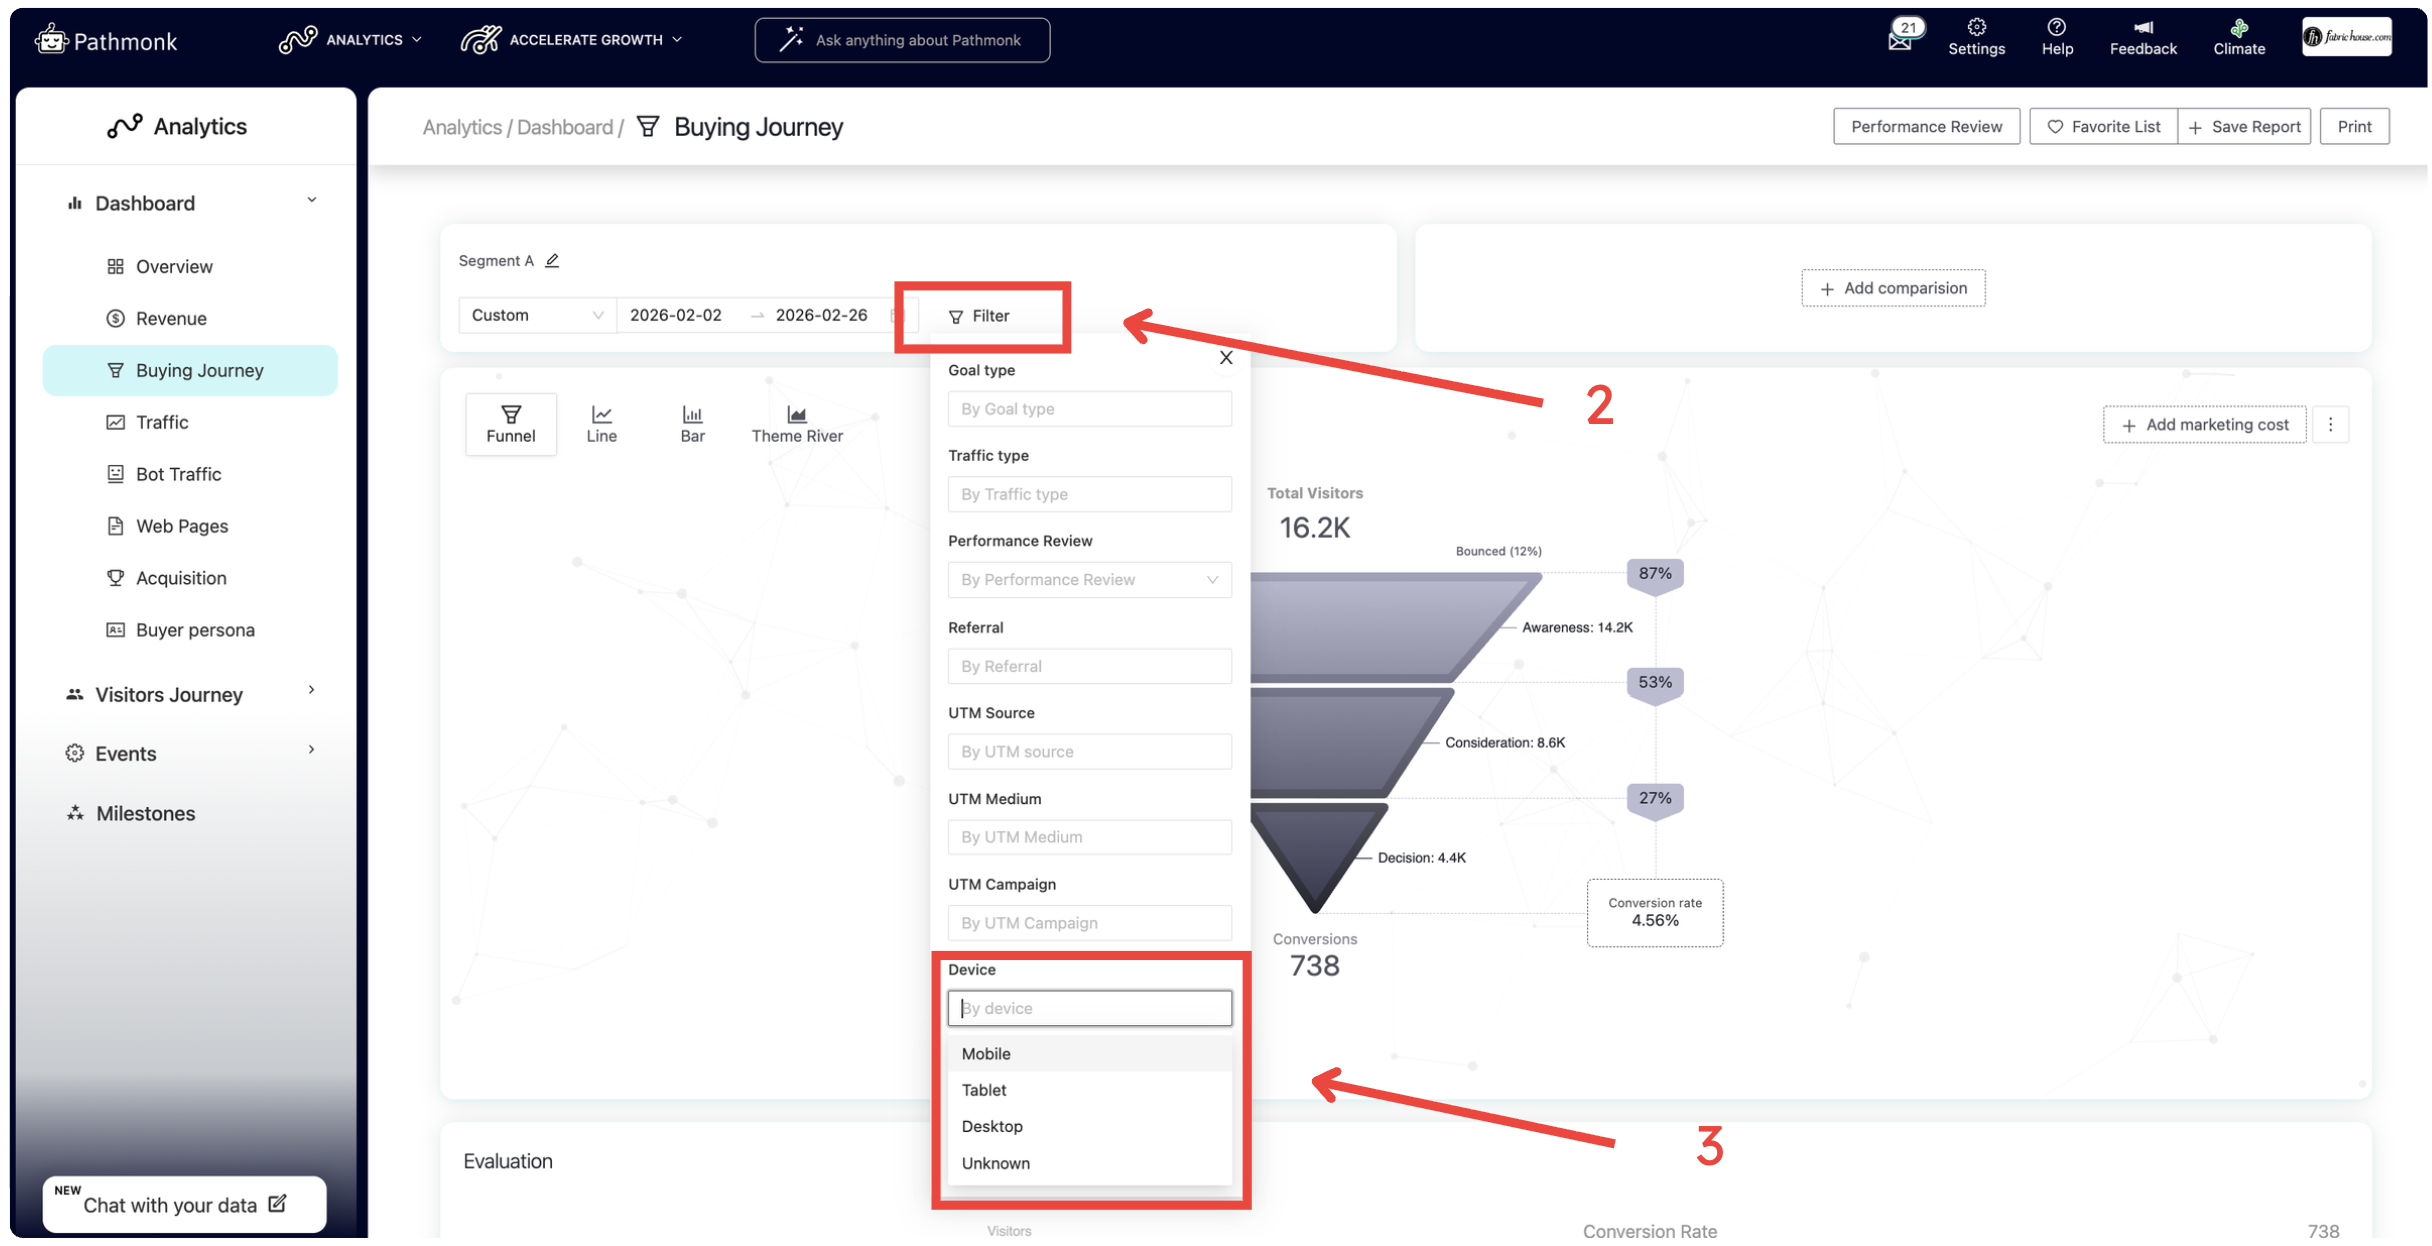
Step 2: Select the device filter
In the list of filters, look for Device. There, you’ll see the available device types:
Mobile
Tablet
Desktop
Unknown
The Unknown category may appear when the system is unable to clearly identify the visitor’s device. This can happen due to browser restrictions, tracking limitations, or missing device information.
Select one or more device types depending on what you’d like to analyze.
Step 3: Apply the filter and analyze
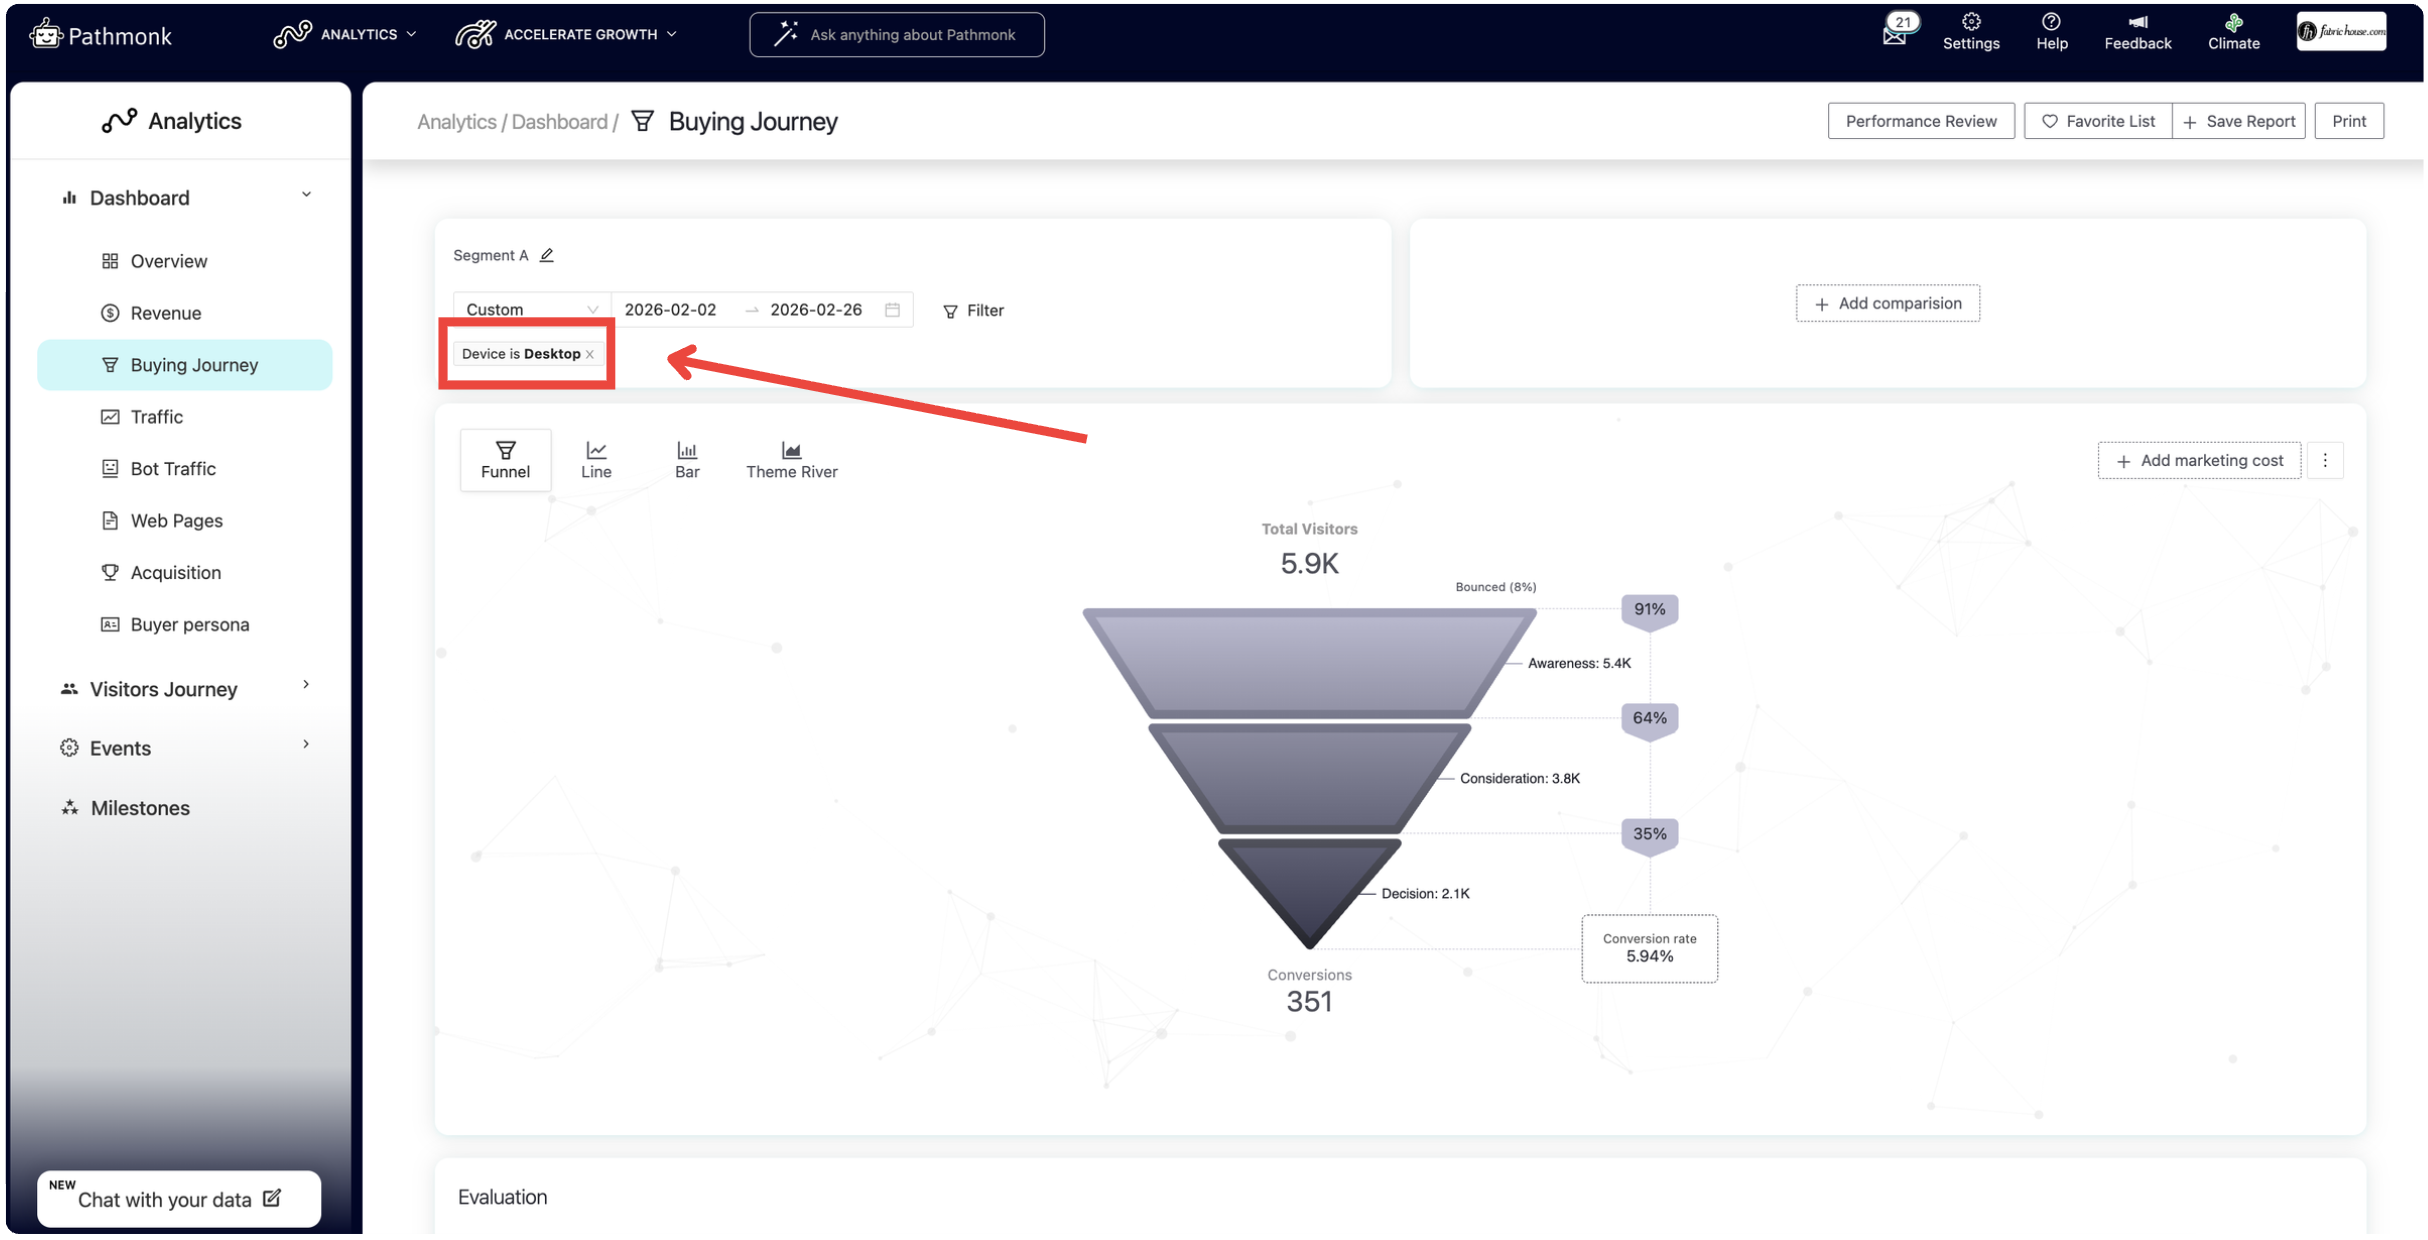
After selecting the desired device(s), make sure to click Apply filter. This step is essential. If you don’t click Apply filter, the report will not update and your selection will not be reflected in the data.
Once applied, the report will refresh automatically, showing how many visitors and how many conversions were generated from the selected device(s). This allows you to quickly compare performance across mobile, tablet, and desktop and gain clearer insights into user behavior.
How to use this filter for deeper analysis
Filtering by device is especially useful when you want to compare performance patterns.
For example, you can:
Compare mobile vs. desktop performance within the same time period to identify differences in conversion rates or user behavior.
Compare desktop performance across two different date ranges to evaluate the impact of changes, campaigns, or experiments.
Analyze whether a drop or increase in conversions is device-specific.
Using the device filter together with the date range selector allows you to isolate variables and gain more precise insights into what is driving performance changes.
Was this article helpful?
That’s Great!
Thank you for your feedback
Sorry! We couldn't be helpful
Thank you for your feedback
Feedback sent
We appreciate your effort and will try to fix the article